机器学习——深度学习(Deep Learning)
最后更新于:2022-04-01 14:29:50
Deep Learning是机器学习中一个非常接近AI的领域,其动机在于建立、模拟人脑进行分析学习的神经网络,最近研究了机器学习中一些深度学习的相关知识,本文给出一些很有用的资料和心得。
Key Words:有监督学习与无监督学习,分类、回归,密度估计、聚类,深度学习,Sparse DBN,
1. 有监督学习和无监督学习
给定一组数据(input,target)为Z=(X,Y)。
有监督学习:最常见的是regression & classification。
regression:Y是实数vector。回归问题,就是拟合(X,Y)的一条曲线,使得下式cost function L最小。

classification:Y是一个finite number,可以看做类标号。分类问题需要首先给定有label的数据训练分类器,故属于有监督学习过程。分类问题中,cost function L(X,Y)是X属于类Y的概率的负对数。

,其中fi(X)=P(Y=i | X);

无监督学习:无监督学习的目的是学习一个function f,使它可以描述给定数据的位置分布P(Z)。 包括两种:density estimation & clustering.
density estimation就是密度估计,估计该数据在任意位置的分布密度
clustering就是聚类,将Z聚集几类(如K-Means),或者给出一个样本属于每一类的概率。由于不需要事先根据训练数据去train聚类器,故属于无监督学习。
PCA和很多deep learning算法都属于无监督学习。
2. [深度学习Deep Learning介绍](http://www.iro.umontreal.ca/~pift6266/H10/notes/deepintro.html)
Depth 概念:depth: the length of the longest path from an input to an output.
Deep Architecture 的三个特点:深度不足会出现问题;人脑具有一个深度结构(每深入一层进行一次abstraction,由lower-layer的features描述而成的feature构成,就是[上篇中提到的feature hierarchy问题](http://blog.csdn.net/abcjennifer/article/details/7804962),而且该hierarchy是一个[稀疏矩阵](http://blog.csdn.net/abcjennifer/article/details/7748833));认知过程逐层进行,逐步抽象
[ 3篇文章](http://www.iro.umontreal.ca/~pift6266/H10/notes/deepintro.html#breakthrough-in-learning-deep-architectures)介绍Deep Belief Networks,作为DBN的breakthrough
3.Deep Learning Algorithm 的核心思想:
把learning hierarchy 看做一个network,则
①无监督学习用于每一层网络的pre-train;
②每次用无监督学习只训练一层,将其训练结果作为其higher一层的输入;
③用监督学习去调整所有层
这里不负责任地理解下,举个例子在Autoencoder中,无监督学习学的是feature,有监督学习用在fine-tuning. 比如每一个neural network 学出的hidden layer就是feature,作为下一次神经网络无监督学习的input……这样一次次就学出了一个deep的网络,每一层都是上一次学习的hidden layer。再用softmax classifier去fine-tuning这个deep network的系数。

这三个点是Deep Learning Algorithm的精髓,我在[上一篇](http://blog.csdn.net/abcjennifer/article/details/7804962)文章中也有讲到,其中第三部分:Learning Features Hierachy & Sparse DBN就讲了如何运用Sparse DBN进行feature学习。
4. Deep Learning 经典阅读材料:
> - The monograph or review paper [Learning Deep Architectures for AI](http://www.iro.umontreal.ca/~lisa/publications2/index.php/publications/show/239) (Foundations & Trends in Machine Learning, 2009).
> - The ICML 2009 Workshop on Learning Feature Hierarchies [webpage](http://www.cs.toronto.edu/~rsalakhu/deeplearning/index.html) has a [list of references](http://www.cs.toronto.edu/~rsalakhu/deeplearning/references.html).
> - The LISA [public wiki](http://www.iro.umontreal.ca/~lisa/twiki/bin/view.cgi/Public/WebHome) has a [reading list](http://www.iro.umontreal.ca/~lisa/twiki/bin/view.cgi/Public/ReadingOnDeepNetworks) and a [bibliography](http://www.iro.umontreal.ca/~lisa/twiki/bin/view.cgi/Public/DeepNetworksBibliography).
> - Geoff Hinton has [readings](http://www.cs.toronto.edu/~hinton/deeprefs.html) from last year’s [NIPS tutorial](http://videolectures.net/jul09_hinton_deeplearn/).
> 阐述Deep learning主要思想的三篇文章:
> - Hinton, G. E., Osindero, S. and Teh, Y., [A fast learning algorithm for deep belief nets](http://www.cs.toronto.edu/~hinton/absps/fastnc.pdf)Neural Computation 18:1527-1554, 2006
> - Yoshua Bengio, Pascal Lamblin, Dan Popovici and Hugo Larochelle, [Greedy Layer-Wise Training of Deep Networks](http://www.iro.umontreal.ca/~lisa/publications2/index.php/publications/show/190), in J. Platt et al. (Eds), Advances in Neural Information Processing Systems 19 (NIPS 2006), pp. 153-160, MIT Press, 2007**<比较了RBM和Auto-encoder>**
> - Marc’Aurelio Ranzato, Christopher Poultney, Sumit Chopra and Yann LeCun [Efficient Learning of Sparse Representations with an Energy-Based Model](http://yann.lecun.com/exdb/publis/pdf/ranzato-06.pdf), in J. Platt et al. (Eds), Advances in Neural Information Processing Systems (NIPS 2006), MIT Press, 2007**<将稀疏自编码用于回旋结构(convolutional architecture)>**
> 06年后,大批deep learning文章涌现,感兴趣的可以看下大牛Yoshua Bengio的综述[Learning deep architectures for {AI}](http://www.iro.umontreal.ca/~lisa/pointeurs/TR1312.pdf),不过本文很长,很长……
5. Deep Learning工具—— [Theano](http://deeplearning.net/software/theano)
[Theano](http://deeplearning.net/software/theano)是deep learning的Python库,要求首先熟悉Python语言和numpy,建议读者先看[Theano basic tutorial](http://deeplearning.net/software/theano/tutorial),然后按照*[Getting Started](http://deeplearning.net/tutorial/gettingstarted.html#gettingstarted) *下载相关数据并用gradient descent的方法进行学习。
学习了Theano的基本方法后,可以练习写以下几个算法:
有监督学习:
1. [*Logistic Regression*](http://deeplearning.net/tutorial/logreg.html#logreg) - using Theano for something simple
1. [*Multilayer perceptron*](http://deeplearning.net/tutorial/mlp.html#mlp) - introduction to layers
1. [*Deep Convolutional Network*](http://deeplearning.net/tutorial/lenet.html#lenet) - a simplified version of LeNet5
无监督学习:
- [*Auto Encoders, Denoising Autoencoders*](http://deeplearning.net/tutorial/dA.html#daa) - description of autoencoders
- [*Stacked Denoising Auto-Encoders*](http://deeplearning.net/tutorial/SdA.html#sda) - easy steps into unsupervised pre-training for deep nets
- [*Restricted Boltzmann Machines*](http://deeplearning.net/tutorial/rbm.html#rbm) - single layer generative RBM model
- [*Deep Belief Networks*](http://deeplearning.net/tutorial/DBN.html#dbn) - unsupervised generative pre-training of stacked RBMs followed by supervised fine-tuning
最后呢,推荐给大家基本ML的书籍:
- [Chris Bishop, “Pattern Recognition and Machine Learning”, 2007](http://research.microsoft.com/en-us/um/people/cmbishop/prml/)
- [Simon Haykin, “Neural Networks: a Comprehensive Foundation”, 2009 (3rd edition)](http://books.google.ca/books?id=K7P36lKzI_QC&dq=simon+haykin+neural+networks+book&source=gbs_navlinks_s)
- [Richard O. Duda, Peter E. Hart and David G. Stork, “Pattern Classification”, 2001 (2nd edition)](http://www.rii.ricoh.com/~stork/DHS.html)
关于Machine Learning更多的学习资料将继续更新,敬请关注本博客和新浪微博[Sophia_qing](http://weibo.com/u/2607574543)。
References:
1. [Brief Introduction to ML for AI](http://www.iro.umontreal.ca/~pift6266/H10/notes/mlintro.html)
2.[Deep Learning Tutorial](http://deeplearning.net/tutorial/)
3.[A tutorial on deep learning - Video](http://videolectures.net/jul09_hinton_deeplearn/)
注明:转自Rachel Zhang的专栏http://blog.csdn.net/abcjennifer/article/details/7826917
稀疏表示字典的显示(MATLAB实现代码)
最后更新于:2022-04-01 14:29:48
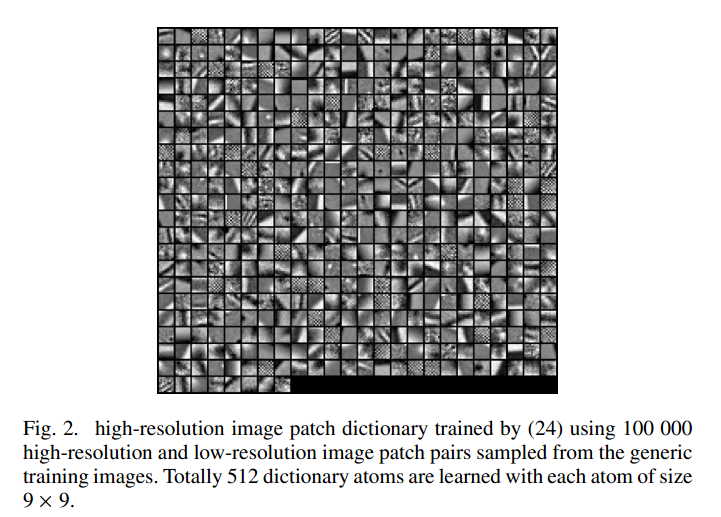
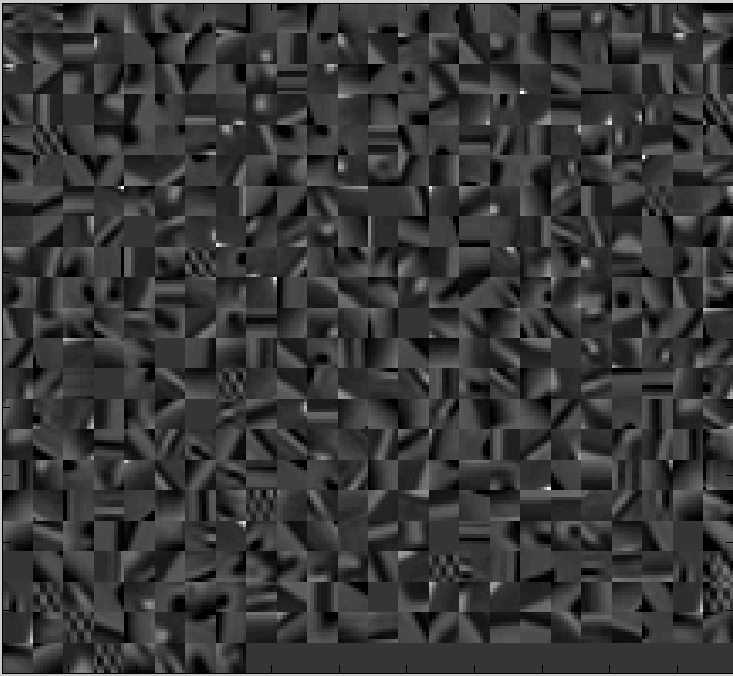
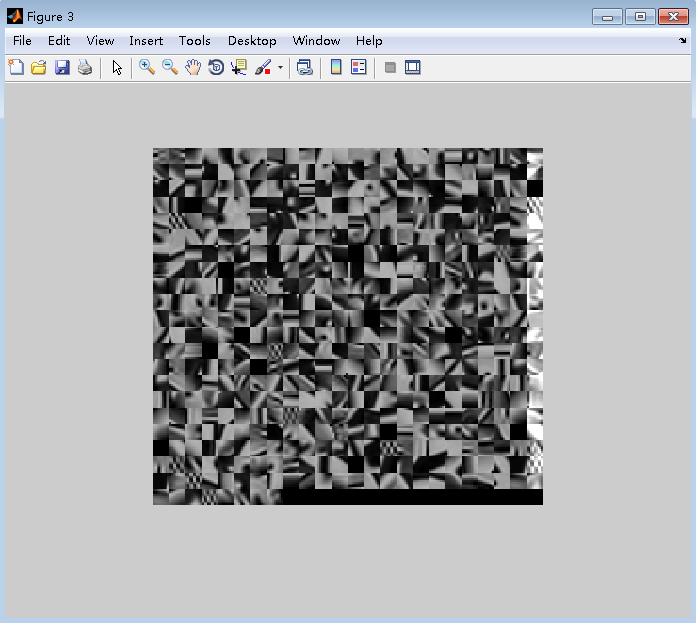
本文主要是实现论文--基于稀疏表示的图像超分辨率《Image Super-Resolution Via Sparse Representation》中的Figure2,通过对100000个高分辨率和低分辨率图像块训练得到的高分辨率图像块字典,字典原子总数为512,图像块尺寸大小为9X9
方法一:
~~~
clc;
clear all;
% load dictionary
load('Dictionary/D_512_0.15_9.mat');
patch_size=9;
nRow=24;
nCol=22;
D=Dh';
w=nCol*patch_size;
h=nRow*patch_size;
gridx = 1:patch_size :w;
gridx = [gridx, w-patch_size+1];
gridy = 1:patch_size : h;
gridy = [gridy, h-patch_size+1];
K=512; %字典原子总数
DD=cell(1,K);
row=length(gridx);
col=length(gridy);
hIm=zeros([w,h]);
for i=1:K
DD{i}=D(i,:);
end
for ii = 1:length(gridx),
for jj = 1:length(gridy),
yy = gridx(ii);
xx = gridy(jj);
if (ii-1)*nRow+jj >K
break
end
temp=DD{(ii-1)*nCol+jj};
hPatch=reshape(temp,[patch_size,patch_size]);
hIm(yy:yy+patch_size-1, xx:xx+patch_size-1) = hIm(yy:yy+patch_size-1, xx:xx+patch_size-1) +hPatch;
end
end
figure;
imagesc(hIm);
colormap(gray);
axis image;
~~~
输出结果:
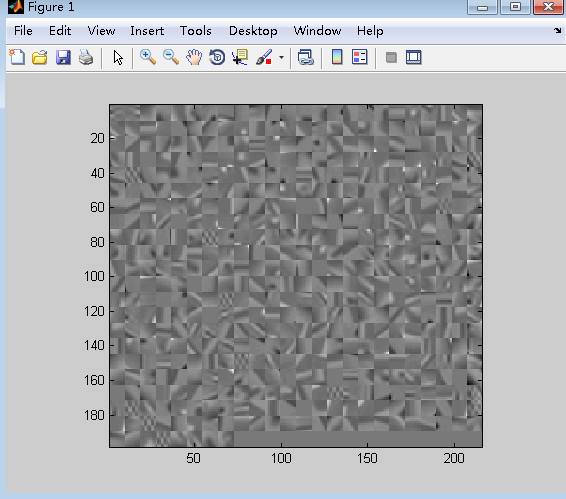
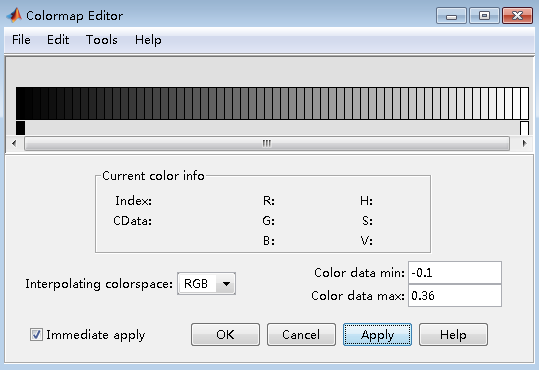
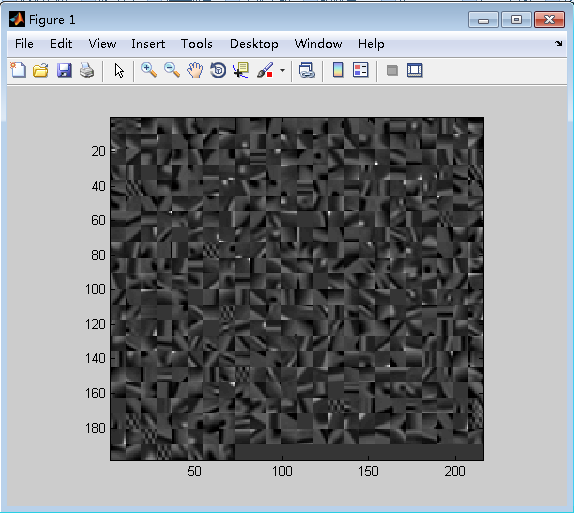
可以看出,相比于论文中字典的显示图,颜色有点浅,通过调节MATLAB的colorbar,可以将背景颜色变深,
结果如下图所示:
方法二:
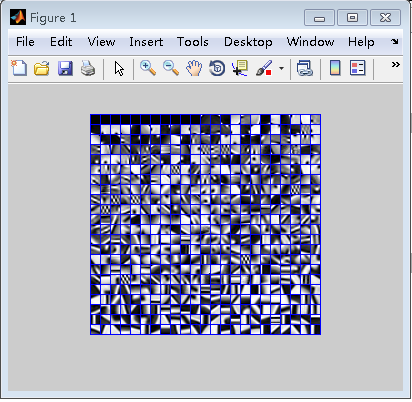
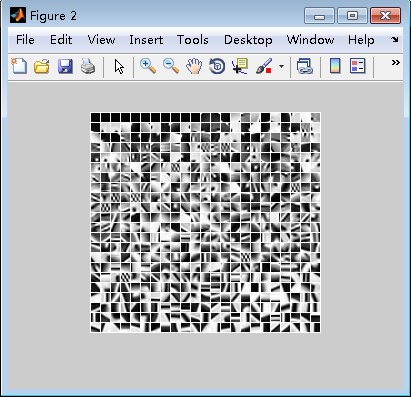
通过http://www.cs.technion.ac.il/~elad/software/提供的ksvd工具箱中的displayDictionaryElementsAsImage( )函数,来实现字典的显示。
displayDictionaryElementsAsImage.m
~~~
function I = displayDictionaryElementsAsImage(D, numRows, numCols,X,Y,sortVarFlag)
% function I = displayDictionaryElementsAsImage(D, numRows, numCols, X,Y)
% displays the dictionary atoms as blocks. For activation, the dictionary D
% should be given, as also the number of rows (numRows) and columns
% (numCols) for the atoms to be displayed. X and Y are the dimensions of
% each atom.
borderSize = 1;
columnScanFlag = 1;
strechEachVecFlag = 1;
showImFlag = 1;
if (length(who('X'))==0)
X = 8;
Y = 8;
end
if (length(who('sortVarFlag'))==0)
sortVarFlag = 1;
end
numElems = size(D,2);
if (length(who('numRows'))==0)
numRows = floor(sqrt(numElems));
numCols = numRows;
end
if (length(who('strechEachVecFlag'))==0)
strechEachVecFlag = 0;
end
if (length(who('showImFlag'))==0)
showImFlag = 1;
end
%%% sort the elements, if necessary.
%%% construct the image to display (I)
sizeForEachImage = sqrt(size(D,1))+borderSize;
I = zeros(sizeForEachImage*numRows+borderSize,sizeForEachImage*numCols+borderSize,3);
%%% fill all this image in blue
I(:,:,1) = 0; %min(min(D));
I(:,:,2) = 0; %min(min(D));
I(:,:,3) = 1; %max(max(D));
%%% now fill the image squares with the elements (in row scan or column
%%% scan).
if (strechEachVecFlag)
for counter = 1:size(D,2)
D(:,counter) = D(:,counter)-min(D(:,counter));
if (max(D(:,counter)))
D(:,counter) = D(:,counter)./max(D(:,counter));
end
end
end
if (sortVarFlag)
vars = var(D);
[V,indices] = sort(vars');
indices = fliplr(indices);
D = [D(:,1:sortVarFlag-1),D(:,indices+sortVarFlag-1)];
signs = sign(D(1,:));
signs(find(signs==0)) = 1;
D = D.*repmat(signs,size(D,1),1);
D = D(:,1:numRows*numCols);
end
counter=1;
for j = 1:numRows
for i = 1:numCols
% if (strechEachVecFlag)
% D(:,counter) = D(:,counter)-min(D(:,counter));
% D(:,counter) = D(:,counter)./max(D(:,counter));
% end
% if (columnScanFlag==1)
% I(borderSize+(i-1)*sizeForEachImage+1:i*sizeForEachImage,borderSize+(j-1)*sizeForEachImage+1:j*sizeForEachImage,1)=reshape(D(:,counter),8,8);
% I(borderSize+(i-1)*sizeForEachImage+1:i*sizeForEachImage,borderSize+(j-1)*sizeForEachImage+1:j*sizeForEachImage,2)=reshape(D(:,counter),8,8);
% I(borderSize+(i-1)*sizeForEachImage+1:i*sizeForEachImage,borderSize+(j-1)*sizeForEachImage+1:j*sizeForEachImage,3)=reshape(D(:,counter),8,8);
% else
% Go in Column Scan:
I(borderSize+(j-1)*sizeForEachImage+1:j*sizeForEachImage,borderSize+(i-1)*sizeForEachImage+1:i*sizeForEachImage,1)=reshape(D(:,counter),X,Y);
I(borderSize+(j-1)*sizeForEachImage+1:j*sizeForEachImage,borderSize+(i-1)*sizeForEachImage+1:i*sizeForEachImage,2)=reshape(D(:,counter),X,Y);
I(borderSize+(j-1)*sizeForEachImage+1:j*sizeForEachImage,borderSize+(i-1)*sizeForEachImage+1:i*sizeForEachImage,3)=reshape(D(:,counter),X,Y);
% end
counter = counter+1;
end
end
if (showImFlag)
I = I-min(min(min(I)));
I = I./max(max(max(I)));
imshow(I,[]);
end
~~~
测试程序
displayDictionary_test.m
~~~
clc;
clear all;
%加载字典
load('F:\Research\ScSR\ScSR\Dictionary\D_512_0.15_9.mat');
patch_size=9;
D=Dh;
K=512;
figure;
%调用KSVD工具箱中的字典显示函数
im=displayDictionaryElementsAsImage(D, floor(sqrt(K)), floor(size(D,2)/floor(sqrt(K))),patch_size,patch_size);
~~~
输出结果:
方法三:
因为方法一显示的字典图像偏灰,对比度不强,所以通过对字典原子像素值进行拉伸变化到0-1,增强图像对比度。
~~~
clc;
clear all;
% load dictionary
load('Dictionary/D_512_0.15_9.mat');
patch_size=9;
nRow=24;
nCol=22;
D=Dh';
w=nCol*patch_size;
h=nRow*patch_size;
gridx = 1:patch_size :w;
gridx = [gridx, w-patch_size+1];
gridy = 1:patch_size : h;
gridy = [gridy, h-patch_size+1];
K=512; %字典原子总数
DD=cell(1,K);
row=length(gridx);
col=length(gridy);
hIm=zeros([w,h]);
for i=1:K
DD{i}=D(i,:);
end
for ii = 1:length(gridx),
for jj = 1:length(gridy),
yy = gridx(ii);
xx = gridy(jj);
if (ii-1)*nRow+jj >K
break
end
temp=DD{(ii-1)*nCol+jj};
hPatch=reshape(temp,[patch_size,patch_size]);
I=hPatch;
I = I-min(min(min(I)));
I = I./max(max(max(I)));%对字典原子像素值进行拉伸变化到0-1
hIm(yy:yy+patch_size-1, xx:xx+patch_size-1) = hIm(yy:yy+patch_size-1, xx:xx+patch_size-1) +I;
end
end
figure;
imshow(hIm);
~~~
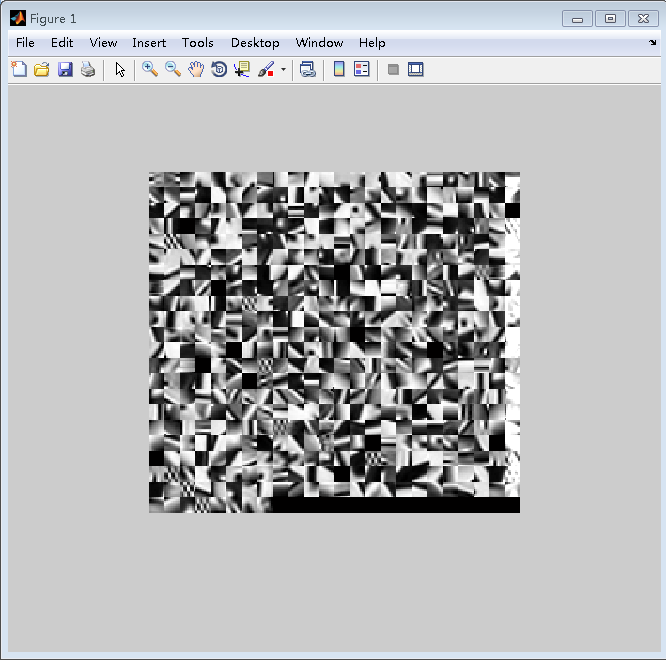
调整参数,将字典原子像素值拉伸变换到0-0.7
~~~
hPatch=reshape(temp,[patch_size,patch_size]);
I=hPatch;
I = I-min(min(min(I)));
I = 0.7*I./max(max(max(I)));%对字典原子像素值进行拉伸变化到0-0.7
~~~
OpenCV的imshow无法正常显示图片
最后更新于:2022-04-01 14:29:46
**问题:**OpenCV的imshow无法正常显示图片
**解决方法:**在imshow()语句下一句添加waitKey(30)
~~~
int main()
{
inputImg = imread("input.bmp");
imshow("input image", inputImg);//显示原图
//waitKey(30);
imgSplit(inputImg);//求取M(x)
imgBlur(mImg);//均值滤波
imgAvg(mImg);//求M(x)中所有元素均值
imgL(blurImg, mImg);//求L(x)
imgMaxInput(inputImg);//求maxImg
A = imgA(imgMaxpx(blurImg), imgMaxpx(maxImg));//求A
imgDefogged(inputImg);//去雾
imshow("defoggedImg", defoggedImg);//显示去雾后的图
imwrite("defoggedImg.bmp", defoggedImg);
//waitKey(0);
system("pause");
return 0;
}
~~~

~~~
#include<opencv2/opencv.hpp>
#include<opencv2/core/core.hpp>
#include<opencv2/imgproc/imgproc.hpp>
#include<opencv2/highgui/highgui.hpp>
#include<opencv/cv.h>
using namespace std;
using namespace cv;
int main()
{
inputImg = imread("input.bmp");
imshow("input image", inputImg);//显示原图
waitKey(30);
imgSplit(inputImg);//求取M(x)
imgBlur(mImg);//均值滤波
imgAvg(mImg);//求M(x)中所有元素均值
imgL(blurImg, mImg);//求L(x)
imgMaxInput(inputImg);//求maxImg
A = imgA(imgMaxpx(blurImg), imgMaxpx(maxImg));//求A
imgDefogged(inputImg);//去雾
imshow("defoggedImg", defoggedImg);//显示去雾后的图
imwrite("defoggedImg.bmp", defoggedImg);
waitKey(0);
system("pause");
return 0;
}
~~~


压缩感知——沃尔什-哈达玛(WHT)变换与逆变换的Matlab代码实现
最后更新于:2022-04-01 14:29:44
沃尔什-哈达玛变换(Walsh-Hadmard Transform,WHT),是一种典型的非正弦函数变换,采用正交直角函数作为基函数,具有与傅里叶函数类似的性质,图像数据越是均匀分布,经过沃尔什-哈达玛变换后的数据越是集中于矩阵的边角上,因此沃尔什变换具有能量集中的性质,可以用于压缩图像信息。
Matlab中的Hadamard函数:
格式:H=hadamard( n ) ,返回一个 n * n的hadamard矩阵。


下面对lena图像进行沃尔什-哈达玛变换与逆变换的Matlab实现:
~~~
clc;
clear all;
im_l=imread('C:\Users\DELL\Desktop\lena.jpg');
im_l1=im2double(im_l);
im_l2=rgb2gray(im_l1);
%对图像进行哈达玛变换
H=hadamard(512);%产生512X512的Hadamard矩阵
haImg=H*im_l2*H;
haImg2=haImg/512;
%对图像进行哈达玛逆变换
hhaImg=H'*haImg2*H';
hhaImg2=hhaImg/512;
haImg1=im2uint8(haImg);
hhaImg1=im2uint8(hhaImg2);
subplot(2,2,1);
imshow(im_l);
title('原图');
subplot(2,2,2);
imshow(im_l2);
title('灰度图');
subplot(2,2,3);
imshow(haImg2);
title('图像的二维离散Hadamard变换');
subplot(2,2,4);
imshow(hhaImg1);
title('图像的二维离散Hadamard逆变换');
~~~

Python实现K-means聚类
最后更新于:2022-04-01 14:29:41
kmeans是最简单的聚类算法之一,但是运用十分广泛。最近在工作中也经常遇到这个算法。kmeans一般在数据分析前期使用,选取适当的k,将数据分类后,然后分类研究不同聚类下数据的特点。
kmeans算法步骤:
1 随机选取k个中心点
2 遍历所有数据,将每个数据划分到最近的中心点中
3 计算每个聚类的平均值,并作为新的中心点
4 重复2-3,直到这k个聚类中心点不再变化(收敛了),或执行了足够多的迭代
下面是一个对二维数据用K-means进行聚类的示例,类中心标记为绿色大圆环,聚类出的两类分别标记为蓝色星号和红色点。
实现代码:
~~~
from scipy.cluster.vq import *
from numpy.random import randn
from numpy import vstack
from numpy import array
from numpy import where
from matplotlib.pyplot import figure
from matplotlib.pyplot import plot
from matplotlib.pyplot import axis
from matplotlib.pyplot import show
class1=1.5*randn(100,2)
class2=randn(100,2)+array([5,5])
features=vstack((class1,class2))
centriods,variance=kmeans(features,2)
code,distance=vq(features,centriods)
figure()
ndx=where(code==0)[0]
plot(features[ndx,0],features[ndx,1],'*')
ndx=where(code==1)[0]
plot(features[ndx,0],features[ndx,1],'r.')
plot(centriods[:,0],centriods[:,1],'go')
axis('off')
show()
~~~

LBP纹理特征
最后更新于:2022-04-01 14:29:39
局部二进制模式(Local binary patterns,LBP)最早是作为一种有有效的纹理描述算子提出的,由于其对图像局部纹理特征的卓越描绘能力而获得了非常广泛的应用。LBP特征具有很强的分类能力(Highly Discriminative)、较高的计算效率并且对于单调的灰度变化具有不变性。LBP方法在1994年首先由T. Ojala, M.Pietikäinen, 和 D. Harwood 提出,是一个计算机视觉中用于图像特征分类的重要方法,后来LBP方法与HOG特征分类器联合使用,改善了一些数据集上的检测效果。
(1)基本LBP
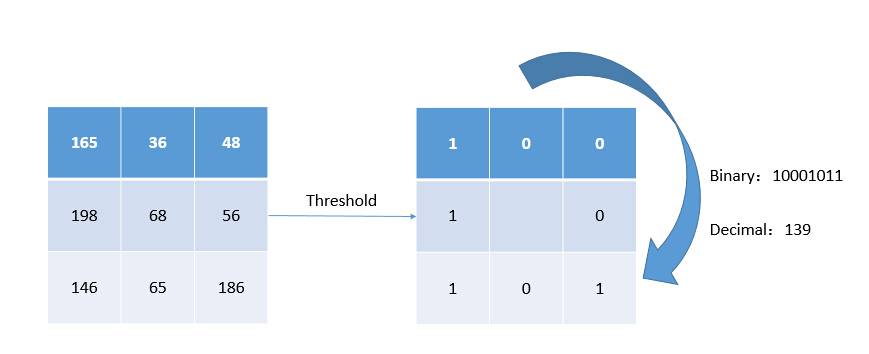
下图给出了一个基本的LBP算子,应用LBP算子的过程类似于滤波过程中的模板操作。逐行扫描图像,对于图像中的每一个像素点,以该点的灰度作为阈值,对周围3X3的8邻域进行二值化,按照一定的顺序将二值化的结果组成一个8位二进制数,以此二进制数的值(0~255)作为该点的响应。
例如,对下图中的3X3区域的中心点,以其灰度值68作为阈值,对其8邻域进行二值化,并且从左上点开始按照顺时针方向(具体的顺序可以任意,只要统一即可)将二值化的结果组成一个二进制数10001011,即十进制的139,作为中心点的响应。
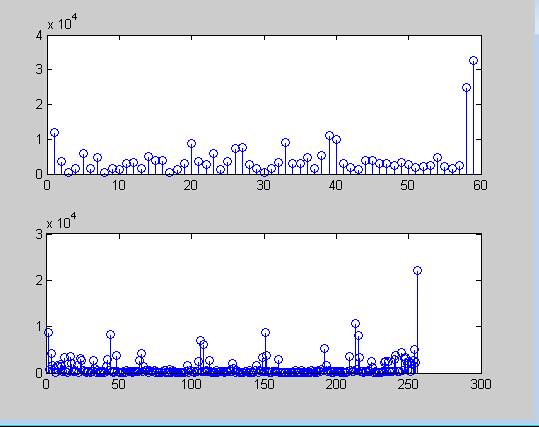
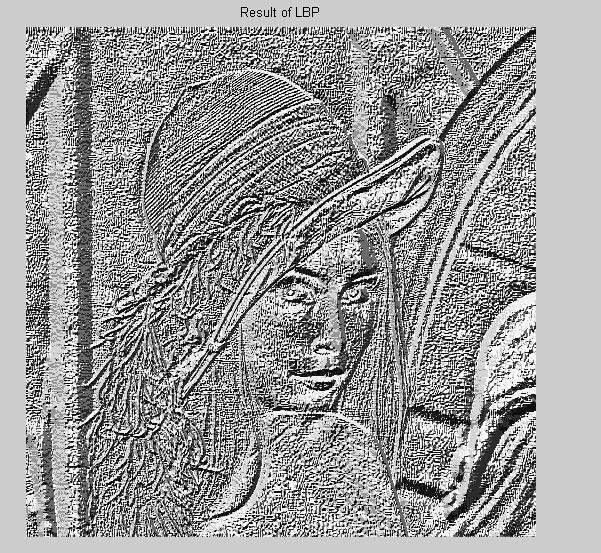
在整个逐行扫描过程结束后,会得到一个LBP响应图像,这个响应图像的直方图被称为LBP统计直方图,或LBP直方图,它常常被作为后续识别工作的特征,因此也被称为LBP特征。
LBP的主要思想是以某一点与其邻域像素的相对灰度作为响应,正是这种相对机制使得LBP算子对于单调的灰度变化具有不变性。人脸图像常常会受到光照因素的影响而产生灰度变化,但在一个局部区域内,这种变化常常可以被视为是单调的,因此LBP在光照不均的人脸识别应用中也取得了很好的效果。
(2)圆形邻域LBP算子
基本LBP算子可以被进一步推广为使用不同大小和形状的邻域。采用圆形的邻域并结合双线性插值运算可以获得任意半径和任意数目的邻域像素点。
如下图, 应用LBP算法的三个邻域示例所示)进行顺时针或逆时针的比较,如果中心像素值比该邻点大,则将邻点赋值为1,否则赋值为0,这样每个点都会获得一个8位二进制数(通常转换为十进制数)。然后计算每个cell的直方图,即每个数字(假定是十进制数)出现的频率(也就是一个关于每一个像素点是否比邻域内点大的一个二进制序列进行统计),然后对该直方图进行归一化处理。最后将得到的每个cell的统计直方图进行连接,就得到了整幅图的LBP纹理特征,然后便可利用SVM或者其他机器学习算法进行分类了。

(3)MATLAB实现
一共有三个m文件,一个是lbp.m, 存放主要的lbp算法,一个是getmapping,用以做算法的辅助函数,一个是cont.m。
1.lbp.m
~~~
%LBP returns the local binary pattern image or LBP histogram of an image.
% J = LBP(I,R,N,MAPPING,MODE) returns either a local binary pattern
% coded image or the local binary pattern histogram of an intensity
% image I. The LBP codes are computed using N sampling points on a
% circle of radius R and using mapping table defined by MAPPING.
% See the getmapping function for different mappings and use 0 for
% no mapping. Possible values for MODE are
% 'h' or 'hist' to get a histogram of LBP codes
% 'nh' to get a normalized histogram
% Otherwise an LBP code image is returned.
%
% J = LBP(I) returns the original (basic) LBP histogram of image I
%
% J = LBP(I,SP,MAPPING,MODE) computes the LBP codes using n sampling
% points defined in (n * 2) matrix SP. The sampling points should be
% defined around the origin (coordinates (0,0)).
%
% Examples
% --------
% I=imread('rice.png');
% mapping=getmapping(8,'u2');
% H1=LBP(I,1,8,mapping,'h'); %LBP histogram in (8,1) neighborhood
% %using uniform patterns
% subplot(2,1,1),stem(H1);
%
% H2=LBP(I);
% subplot(2,1,2),stem(H2);
%
% SP=[-1 -1; -1 0; -1 1; 0 -1; -0 1; 1 -1; 1 0; 1 1];
% I2=LBP(I,SP,0,'i'); %LBP code image using sampling points in SP
% %and no mapping. Now H2 is equal to histogram
% %of I2.
function result = lbp(varargin) % image,radius,neighbors,mapping,mode)
% Version 0.3.3
% Authors: Marko Heikkil?and Timo Ahonen
% Changelog
% Version 0.3.2: A bug fix to enable using mappings together with a
% predefined spoints array
% Version 0.3.1: Changed MAPPING input to be a struct containing the mapping
% table and the number of bins to make the function run faster with high number
% of sampling points. Lauge Sorensen is acknowledged for spotting this problem.
% Check number of input arguments.
error(nargchk(1,5,nargin));
image=varargin{1};
d_image=double(image);
if nargin==1
spoints=[-1 -1; -1 0; -1 1; 0 -1; -0 1; 1 -1; 1 0; 1 1];
neighbors=8;
mapping=0;
mode='h';
end
if (nargin == 2) && (length(varargin{2}) == 1)
error('Input arguments');
end
if (nargin > 2) && (length(varargin{2}) == 1)
radius=varargin{2};
neighbors=varargin{3};
spoints=zeros(neighbors,2);
% Angle step.
a = 2*pi/neighbors;
for i = 1:neighbors
spoints(i,1) = -radius*sin((i-1)*a);
spoints(i,2) = radius*cos((i-1)*a);
end
if(nargin >= 4)
mapping=varargin{4};
if(isstruct(mapping) && mapping.samples ~= neighbors)
error('Incompatible mapping');
end
else
mapping=0;
end
if(nargin >= 5)
mode=varargin{5};
else
mode='h';
end
end
if (nargin > 1) && (length(varargin{2}) > 1)
spoints=varargin{2};
neighbors=size(spoints,1);
if(nargin >= 3)
mapping=varargin{3};
if(isstruct(mapping) && mapping.samples ~= neighbors)
error('Incompatible mapping');
end
else
mapping=0;
end
if(nargin >= 4)
mode=varargin{4};
else
mode='h';
end
end
% Determine the dimensions of the input image.
[ysize xsize] = size(image);
miny=min(spoints(:,1));
maxy=max(spoints(:,1));
minx=min(spoints(:,2));
maxx=max(spoints(:,2));
% Block size, each LBP code is computed within a block of size bsizey*bsizex
bsizey=ceil(max(maxy,0))-floor(min(miny,0))+1;
bsizex=ceil(max(maxx,0))-floor(min(minx,0))+1;
% Coordinates of origin (0,0) in the block
origy=1-floor(min(miny,0));
origx=1-floor(min(minx,0));
% Minimum allowed size for the input image depends
% on the radius of the used LBP operator.
if(xsize < bsizex || ysize < bsizey)
error('Too small input image. Should be at least (2*radius+1) x (2*radius+1)');
end
% Calculate dx and dy;
dx = xsize - bsizex;
dy = ysize - bsizey;
% Fill the center pixel matrix C.
C = image(origy:origy+dy,origx:origx+dx);
d_C = double(C);
bins = 2^neighbors;
% Initialize the result matrix with zeros.
result=zeros(dy+1,dx+1);
%Compute the LBP code image
for i = 1:neighbors
y = spoints(i,1)+origy;
x = spoints(i,2)+origx;
% Calculate floors, ceils and rounds for the x and y.
fy = floor(y); cy = ceil(y); ry = round(y);
fx = floor(x); cx = ceil(x); rx = round(x);
% Check if interpolation is needed.
if (abs(x - rx) < 1e-6) && (abs(y - ry) < 1e-6)
% Interpolation is not needed, use original datatypes
N = image(ry:ry+dy,rx:rx+dx);
D = N >= C;
else
% Interpolation needed, use double type images
ty = y - fy;
tx = x - fx;
% Calculate the interpolation weights.
w1 = roundn((1 - tx) * (1 - ty),-6);
w2 = roundn(tx * (1 - ty),-6);
w3 = roundn((1 - tx) * ty,-6) ;
% w4 = roundn(tx * ty,-6) ;
w4 = roundn(1 - w1 - w2 - w3, -6);
% Compute interpolated pixel values
N = w1*d_image(fy:fy+dy,fx:fx+dx) + w2*d_image(fy:fy+dy,cx:cx+dx) + ...
w3*d_image(cy:cy+dy,fx:fx+dx) + w4*d_image(cy:cy+dy,cx:cx+dx);
N = roundn(N,-4);
D = N >= d_C;
end
% Update the result matrix.
v = 2^(i-1);
result = result + v*D;
end
%Apply mapping if it is defined
if isstruct(mapping)
bins = mapping.num;
for i = 1:size(result,1)
for j = 1:size(result,2)
result(i,j) = mapping.table(result(i,j)+1);
end
end
end
if (strcmp(mode,'h') || strcmp(mode,'hist') || strcmp(mode,'nh'))
% Return with LBP histogram if mode equals 'hist'.
result=hist(result(:),0:(bins-1));
if (strcmp(mode,'nh'))
result=result/sum(result);
end
else
%Otherwise return a matrix of unsigned integers
if ((bins-1)<=intmax('uint8'))
result=uint8(result);
elseif ((bins-1)<=intmax('uint16'))
result=uint16(result);
else
result=uint32(result);
end
end
end
function x = roundn(x, n)
error(nargchk(2, 2, nargin, 'struct'))
validateattributes(x, {'single', 'double'}, {}, 'ROUNDN', 'X')
validateattributes(n, ...
{'numeric'}, {'scalar', 'real', 'integer'}, 'ROUNDN', 'N')
if n < 0
p = 10 ^ -n;
x = round(p * x) / p;
elseif n > 0
p = 10 ^ n;
x = p * round(x / p);
else
x = round(x);
end
end
~~~
2.getmapping.m
~~~
%GETMAPPING returns a structure containing a mapping table for LBP codes.
% MAPPING = GETMAPPING(SAMPLES,MAPPINGTYPE) returns a
% structure containing a mapping table for
% LBP codes in a neighbourhood of SAMPLES sampling
% points. Possible values for MAPPINGTYPE are
% 'u2' for uniform LBP
% 'ri' for rotation-invariant LBP
% 'riu2' for uniform rotation-invariant LBP.
%
% Example:
% I=imread('rice.tif');
% MAPPING=getmapping(16,'riu2');
% LBPHIST=lbp(I,2,16,MAPPING,'hist');
% Now LBPHIST contains a rotation-invariant uniform LBP
% histogram in a (16,2) neighbourhood.
%
function mapping = getmapping(samples,mappingtype)
% Version 0.2
% Authors: Marko Heikkil?, Timo Ahonen and Xiaopeng Hong
% Changelog
% 0.1.1 Changed output to be a structure
% Fixed a bug causing out of memory errors when generating rotation
% invariant mappings with high number of sampling points.
% Lauge Sorensen is acknowledged for spotting this problem.
% Modified by Xiaopeng HONG and Guoying ZHAO
% Changelog
% 0.2
% Solved the compatible issue for the bitshift function in Matlab
% 2012 & higher
matlab_ver = ver('MATLAB');
matlab_ver = str2double(matlab_ver.Version);
if matlab_ver < 8
mapping = getmapping_ver7(samples,mappingtype);
else
mapping = getmapping_ver8(samples,mappingtype);
end
end
function mapping = getmapping_ver7(samples,mappingtype)
disp('For Matlab version 7.x and lower');
table = 0:2^samples-1;
newMax = 0; %number of patterns in the resulting LBP code
index = 0;
if strcmp(mappingtype,'u2') %Uniform 2
newMax = samples*(samples-1) + 3;
for i = 0:2^samples-1
j = bitset(bitshift(i,1,samples),1,bitget(i,samples)); %rotate left
numt = sum(bitget(bitxor(i,j),1:samples)); %number of 1->0 and
%0->1 transitions
%in binary string
%x is equal to the
%number of 1-bits in
%XOR(x,Rotate left(x))
if numt <= 2
table(i+1) = index;
index = index + 1;
else
table(i+1) = newMax - 1;
end
end
end
if strcmp(mappingtype,'ri') %Rotation invariant
tmpMap = zeros(2^samples,1) - 1;
for i = 0:2^samples-1
rm = i;
r = i;
for j = 1:samples-1
r = bitset(bitshift(r,1,samples),1,bitget(r,samples)); %rotate
%left
if r < rm
rm = r;
end
end
if tmpMap(rm+1) < 0
tmpMap(rm+1) = newMax;
newMax = newMax + 1;
end
table(i+1) = tmpMap(rm+1);
end
end
if strcmp(mappingtype,'riu2') %Uniform & Rotation invariant
newMax = samples + 2;
for i = 0:2^samples - 1
j = bitset(bitshift(i,1,samples),1,bitget(i,samples)); %rotate left
numt = sum(bitget(bitxor(i,j),1:samples));
if numt <= 2
table(i+1) = sum(bitget(i,1:samples));
else
table(i+1) = samples+1;
end
end
end
mapping.table=table;
mapping.samples=samples;
mapping.num=newMax;
end
function mapping = getmapping_ver8(samples,mappingtype)
disp('For Matlab version 8.0 and higher');
table = 0:2^samples-1;
newMax = 0; %number of patterns in the resulting LBP code
index = 0;
if strcmp(mappingtype,'u2') %Uniform 2
newMax = samples*(samples-1) + 3;
for i = 0:2^samples-1
i_bin = dec2bin(i,samples);
j_bin = circshift(i_bin',-1)'; %circularly rotate left
numt = sum(i_bin~=j_bin); %number of 1->0 and
%0->1 transitions
%in binary string
%x is equal to the
%number of 1-bits in
%XOR(x,Rotate left(x))
if numt <= 2
table(i+1) = index;
index = index + 1;
else
table(i+1) = newMax - 1;
end
end
end
if strcmp(mappingtype,'ri') %Rotation invariant
tmpMap = zeros(2^samples,1) - 1;
for i = 0:2^samples-1
rm = i;
r_bin = dec2bin(i,samples);
for j = 1:samples-1
r = bin2dec(circshift(r_bin',-1*j)'); %rotate left
if r < rm
rm = r;
end
end
if tmpMap(rm+1) < 0
tmpMap(rm+1) = newMax;
newMax = newMax + 1;
end
table(i+1) = tmpMap(rm+1);
end
end
if strcmp(mappingtype,'riu2') %Uniform & Rotation invariant
newMax = samples + 2;
for i = 0:2^samples - 1
i_bin = dec2bin(i,samples);
j_bin = circshift(i_bin',-1)';
numt = sum(i_bin~=j_bin);
if numt <= 2
table(i+1) = sum(bitget(i,1:samples));
else
table(i+1) = samples+1;
end
end
end
mapping.table=table;
mapping.samples=samples;
mapping.num=newMax;
end
~~~
3.cont.m
~~~
%C computes the VAR descriptor.
% J = CONT(I,R,N,LIMS,MODE) returns either a rotation invariant local
% variance (VAR) image or a VAR histogram of the image I. The VAR values
% are determined for all pixels having neighborhood defined by the input
% arguments. The VAR operator calculates variance on a circumference of
% R radius circle. The circumference is discretized into N equally spaced
% sample points. Function returns descriptor values in a continuous form or
% in a discrete from if the quantization limits are defined in the argument
% LIMS.
%
% Examples
% --------
%
% im = imread('rice.png');
% c = cont(im,4,16);
% d = cont(im,4,16,1:500:2000);
%
% figure
% subplot(121),imshow(c,[]), title('VAR image')
% subplot(122),imshow(d,[]), title('Quantized VAR image')
function result = cont(varargin)
% Version: 0.1.0
% Check number of input arguments.
error(nargchk(1,5,nargin));
image=varargin{1};
d_image=double(image);
if nargin==1
spoints=[-1 -1; -1 0; -1 1; 0 -1; -0 1; 1 -1; 1 0; 1 1];
neighbors=8;
lims=0;
mode='i';
end
if (nargin > 2) && (length(varargin{2}) == 1)
radius=varargin{2};
neighbors=varargin{3};
spoints=zeros(neighbors,2);
lims=0;
mode='i';
% Angle step.
a = 2*pi/neighbors;
for i = 1:neighbors
spoints(i,1) = -radius*sin((i-1)*a);
spoints(i,2) = radius*cos((i-1)*a);
end
if(nargin >= 4 && ~ischar(varargin{4}))
lims=varargin{4};
end
if(nargin >= 4 && ischar(varargin{4}))
mode=varargin{4};
end
if(nargin == 5)
mode=varargin{5};
end
end
if (nargin == 2) && ischar(varargin{2})
mode=varargin{2};
spoints=[-1 -1; -1 0; -1 1; 0 -1; -0 1; 1 -1; 1 0; 1 1];
neighbors=8;
lims=0;
end
% Determine the dimensions of the input image.
[ysize xsize] = size(image);
miny=min(spoints(:,1));
maxy=max(spoints(:,1));
minx=min(spoints(:,2));
maxx=max(spoints(:,2));
% Block size, each LBP code is computed within a block of size bsizey*bsizex
bsizey=ceil(max(maxy,0))-floor(min(miny,0))+1;
bsizex=ceil(max(maxx,0))-floor(min(minx,0))+1;
% Coordinates of origin (0,0) in the block
origy=1-floor(min(miny,0));
origx=1-floor(min(minx,0));
% Minimum allowed size for the input image depends
% on the radius of the used LBP operator.
if(xsize < bsizex || ysize < bsizey)
error('Too small input image. Should be at least (2*radius+1) x (2*radius+1)');
end
% Calculate dx and dy;
dx = xsize - bsizex;
dy = ysize - bsizey;
%Compute the local contrast
for i = 1:neighbors
y = spoints(i,1)+origy;
x = spoints(i,2)+origx;
% Calculate floors and ceils for the x and y.
fy = floor(y); cy = ceil(y);
fx = floor(x); cx = ceil(x);
% Use double type images
ty = y - fy;
tx = x - fx;
% Calculate the interpolation weights.
w1 = (1 - tx) * (1 - ty);
w2 = tx * (1 - ty);
w3 = (1 - tx) * ty ;
w4 = tx * ty ;
% Compute interpolated pixel values
N = w1*d_image(fy:fy+dy,fx:fx+dx) + w2*d_image(fy:fy+dy,cx:cx+dx) + ...
w3*d_image(cy:cy+dy,fx:fx+dx) + w4*d_image(cy:cy+dy,cx:cx+dx);
% Compute the variance using on-line algorithm
% ( http://en.wikipedia.org/wiki/Algorithms_for_calculating_variance#On-line_algorithm ).
if i == 1
MEAN=zeros(size(N));
DELTA=zeros(size(N));
M2=zeros(size(N));
end
DELTA=N-MEAN;
MEAN=MEAN+DELTA/i;
M2=M2+DELTA.*(N-MEAN);
end
% Compute the variance matrix.
% Optional estimate for variance:
% VARIANCE_n=M2/neighbors;
result=M2/(neighbors-1);
% Quantize if LIMS is given
if lims
[q r s]=size(result);
quant_vector=q_(result(:),lims);
result=reshape(quant_vector,q,r,s);
if strcmp(mode,'h')
% Return histogram
result=hist(result, length(lims)-1);
end
end
if strcmp(mode,'h') && ~lims
% Return histogram
%epoint = round(max(result(:)));
result=hist(result(:),0:1:1e4);
end
end
function indx = q_(sig,partition)
[nRows, nCols] = size(sig);
indx = zeros(nRows, nCols);
for i = 1 : length(partition)
indx = indx + (sig > partition(i));
end
end
~~~
~~~
%%LBP_test.m
Img=imread('lena.jpg');
I=rgb2gray(Img);
mapping=getmapping(8,'u2');
H1=LBP(I,1,8,mapping,'h'); %LBP histogram in (8,1) neighborhood
%using uniform patterns
subplot(2,1,1),stem(H1);
H2=LBP(I);
subplot(2,1,2),stem(H2);
SP=[-1 -1; -1 0; -1 1; 0 -1; -0 1; 1 -1; 1 0; 1 1];
I2=LBP(I,SP,0,'i'); %LBP code image using sampling points in SP
%and no mapping. Now H2 is equal to histogram of I2.
% show the images
figure, imshow(I);
title('Input Image');
figure, imshow(I2);
title('Result of LBP');
~~~

图像超分辨技术(Image Super Resolution)
最后更新于:2022-04-01 14:29:37


基于稀疏表示的图像超分辨率《Image Super-Resolution Via Sparse Representation》
最后更新于:2022-04-01 14:29:35
由于最近正在做图像超分辨重建方面的研究,有幸看到了杨建超老师和马毅老师等大牛于2010年发表的一篇关于图像超分辨率的经典论文《ImageSuper-Resolution Via Sparse Representation》,于是对该论文进行大概的翻译,如有不当之处,还请大家帮忙多多指正!!!
英文原文:Jianchao Yang, John Wright, Thomas Huang, and Yi Ma. Image super-resolution via sparse representation. IEEE Transactions on Image Processing (TIP), vol. 19, issue 11, 2010.
下载地址:[http://ieeexplore.ieee.org.sci-hub.org/xpls/abs_all.jsp?arnumber=5466111](http://ieeexplore.ieee.org.sci-hub.org/xpls/abs_all.jsp?arnumber=5466111)译文:
**基于稀疏表示的图像超分辨率**
摘要:本文提出了一种基于稀疏信号表示来实现单幅图像超分辨率重建的新方法。研究图像的统计数据表明,图像块可以表示为选择适当超完备字典的稀疏线性组合形式,通过这种观测报告的启发,我们寻求一种对低分辨率输入图像块的稀疏表示,然后用此稀疏表示的系数来生成高分辨率输出。压缩感知理论(Compressive Sensing,CS)指出,一幅图像能够在非常苛刻的条件下由它的一组稀疏表示系数在超完备字典上得到精确重建。通过对低分辨率图像块字典和高分辨率图像块字典的联合训练,我们可以强化低分辨率和高分辨率图像块与之对应真实字典稀疏表示的相似性,从而低分辨率图像块的稀疏表示和高分辨率超完备字典一起作用可以重建出高分辨率图像块,然后由高分辨率图像块连接得到最终完整的高分辨率图像。学习字典对是块对更紧凑的表示,它只需对大量图像块对进行采样,相比传统方法,该方法的计算成本得到显著地降低。稀疏表示的有效性在图像超分辨率重建和人脸幻构(face hallucination)的特殊情况下均得到了证明。在这两种情况下,我们的算法生成的高分辨率图像具有极大的竞争性,甚至在生成图像的质量上比其他类似的图像超分辨率(SR)方法更有优势。此外,我们这种方法的局部稀疏模型对噪声具有自适应鲁棒性,因此,该算法可以在一个更统一的框架下对有噪声输入的图像进行图像超分辨率处理。
关键词:人脸幻构,图像超分辨率,非负矩阵分解,稀疏编码,稀疏表示
### 一、前言
超分辨率图像重建是当前非常活跃的一个研究领域,它克服一些低成本成像传感器(例如,手机或监控摄像机)固有分辨率的限制,并且使高分辨率显示器(例如,高清液晶显示器)得到更好的利用。这样的分辨率增强技术也可能在医疗影像和卫星成像中被证明是必不可少的,因其从低质量图像中诊断或分析是非常困难的。传统方法生成超分辨率图像通常需要输入同一场景的多幅低分辨率图像,所以这些方法也需要对亚像素精度进行对准。图像超分辨率重建的过程可以看作是低分辨率图像融合恢复出原始高分辨率图像的逆问题,这一问题是以合理假设或先验知识将高分辨率图像映射成低分辨率图像的观测模型为基础的。SR重建的基本约束,就是对恢复的图像应用相同的生成模型后,本应该重新生成所观测的低分辨率图像,然而,超分辨率图像重建本身是一个病态问题(ill-posed problem),因其低分辨率图像数量不足,病态的登记和未知的模糊算子,以及重构约束的解不唯一,为了更进一步稳定这个病态问题反演的各种正则化方法也不断被提出。
然而,当所需的放大因子变大或可用的输入图像数量很少时,这些基于重建的SR算法性能将急剧降低。在这些情况下,结果可能是过于光滑,丢失重要的高频细节信息。另一类是基于插值的图像超分辨率方法,虽然简单的插值方法如双线性或双三次插值会产生带有振铃和锯齿伪影的过平滑图像,但是利用自然图像先验知识进行插值通常会产生更好的结果。Dai等人提出用背景/前景描述算子来表示局部图像块和重建两个图像块之间的尖锐不连续。Sun等人探索出了针对局部图像结构的梯度轮廓的研究方法并应用于图像超分辨率重建,这种方法在放大图像边缘信息的保留方面比较有效。然而,它们对于模拟实际图像的视觉复杂性却是有限的,对自然图像的精细纹理或渐变,这些方法往往会产生类似水彩画的假象。
图像超分辨率重建技术的第三类方法是基于机器学习的方法,这种方法主要利用低分辨率和高分辨率图像块的先验知识来进行SR重建。【9】提出了针对普通格式图像的基于实例学习的方法,该方法主要是通过置信传播的马尔科夫随机场(MRF)来预测低分辨率到高分辨率图像的重建过程;【10】使用初始简图增强模糊边缘、脊、角点,然而,这和先前方法一样需要巨大的数据库要求和成千上万的高分辨率和低分辨率图像块对,自言而然它的计算复杂度也就很高了;【11】采纳了流行学习局部线性嵌入的方法,推定高分辨率和低分辨率图像块空间存在相似的流行向量,该算法是将低分辨率图像块的局部几何空间映射投影到高分辨率图像块几何空间,从而生成一个线性邻域组合,利用这种方法,更多的图像块模式可以用一些更小的训练集来表示,然而,由于过拟合或欠拟合,K邻域重建方法经常会造成模糊效应。上文中提出了一种基于稀疏编码的自适应选择最相关重建邻域,有效避免了过拟合和欠拟合,但缺点是对大量采样图像块数据库的稀疏编码是比较耗时的。
尽管已经有了很多通用的图像超分辨率重建方法,但是针对特定的领域(比如人脸图像)需要采取特定的SR处理方法。人脸幻构的问题是由Baker和Kanade首次提出来的,然而,基于梯度金字塔的预测并没有直接对人脸先验知识进行建模,像素的单独预测也造成了间断点和假象。Liu等人提出了融合PCA主成分分析和局部图像块建模的“两步走”统计方法,虽然这种方法可以得到比较好的结果,但是整体PCA主成分分析模型得到的平均脸和概率局部图像块模型是很复杂和计算量很大的。WeiLiu等人提出了一种基于TensorPatches和剩余补偿的新方法,虽然该算法可以得到更多的脸部细节,但是它也会相应地产生更多的假象。
本文重点研究低分辨率图像的超分辨率重建问题,类似于上述基于学习的方法,我们也将依靠输入的图像块信息,不同的是,我们是首先对图像块对进行压缩表示,而不是直接处理低分辨率和高分辨率图像块对,这样显著地提高了算法速度。我们的方法主要是受到近期关于稀疏信号表示研究的启发,研究表明高分辨率信号可以由它们低维投影的线性关系重新恢复出来,尽管图像超分辨重建是一个不可能精确恢复的病态问题,但是依靠图像块的稀疏表示,这个逆问题的鲁棒性和有效性可以得到很大的改善。
**1.基本思路**

### 二、基于稀疏度的图像超分辨率重建
**1.重建约束条件**

**2.稀疏先验知识**

**2.1基于稀疏表示的普通图像SR重建**
**2.1.1稀疏表示的局部模型**

**2.1.2全局重建的约束增强**

**2.1.3全局优化**

**2.2基于稀疏表示的人脸图像SR重建**
人脸图像分辨率增强在监控方面需求较大,由于监控摄像头和感兴趣的目标物体(或人)一般距离较远,与上述普通图像的SR重建不同,人脸图像的结构更加规则,所以更容易处理。对于人脸SR,基本思想:首先利用人脸先验知识将输入低分辨率图像放大到合适的中等分辨率图像,然后利用局部稀疏先验模型来恢复细节。确切的说,过程应该分两步:
(1) 全局建模:利用重建约束恢复出中等分辨率人脸图像,但是这只能在人脸子空间中处理;
(2) 局部建模:利用局部稀疏模型恢复细节。
**2.2.1非负矩阵分解(NMF)**
人脸SR中最常用的子空间建模方法就是主成分分析(PCA),它主要是选取低维子空间,然而PCA是基于全局的方法,和中值一样会产生平滑脸,并且由于主成分表示会出现负系数,所以PCA重建过程往往也是很难描述的。
尽管人脸是包含无数方差的物体,但是它也是由几个相对独立的部分组成的,比如眼睛,眉毛,鼻子,嘴巴,脸颊和下巴。非负矩阵分解NMF把所给人脸图像信号表示成局部特征的一种相加组合,为了找到合适的基于部分的子空间,非负矩阵分解NMF转换成如下的优化问题:

**2.2.2“两步”人脸SR重建**
基于最大后验概率(MAP)

算法2(基于稀疏表示的人脸幻构)

### 三、学习字典对
**3.1.单一字典训练**

这是一个带有二次约束的二次规划问题,存在很多优化方案;
**3.2. 联合字典训练**
给定采样训练图像块对,其中是高分辨率图像块的样本集,是低分辨率图像块的样本集,我们的目的是为了实现对高分辨率和低分辨率图像块学习字典的稀疏表示,对高分辨率图像块的稀疏表示和低分辨率图像块的稀疏表示方法是一样的,同时由于图像SR重建本身是就是一个病态(ill-posed)问题,所以这在实际处理也是比较困难的,高分辨率和低分辨率图像块空间各自的稀疏编码问题分别是:
假如把这些组合起来,用相同的编码来表示高分辨率和低分辨率图像块,表达式可以转换为:

**3.3 低分辨率图像块的特征表示**
考虑到一阶和二阶导数的简单高效,本文主要使用一阶和二阶导数作为低分辨率图像块的特征,以下是用来提取导数的四个一维滤波器:

这四个滤波器处理每个图像块可以产生四个特征向量,通过连接组合作为低分辨率图像块的最终表示,我们的实现方法中,这四个滤波器并不是直接作用于采样的低分辨率图像块,而是作用于训练的图像,所以对每一幅低分辨率训练图像,可以得到四个渐变映射,然后从这些渐变映射每个位置提取四个图像块并将其连接成为特征向量。因此,每个低分辨率图像块的特征表示也将其领域信息编码进去,这将更好地预测最终SR重建图像的邻边信息。
实际中,我们发现从低分辨率图像的上采样图像中提取特征效果要好于原始图像。
### 四、实验结果
**4.1 单幅图像的SR重建**
**4.1.1 普通图像的SR重建**


**4.1.2 脸部图像的SR重建**


**4.2 字典大小的影响**

**4.3 对噪声的鲁棒性**

**4.4 全局约束的影响**

### 五、总结
本文提出了一种新颖的基于稀疏表示的单幅图像超分辨率重建算法,基本思想是通过对高分辨率超完备字典和低分辨率超完备字典进行联合训练以保证它们稀疏表示系数的一致性,这种方法使得局部和全局的相邻图像块之间的兼容性均得到了加强,实验结果表明这种基于图像块先验知识的稀疏表示对普通图像和人脸图像都有很好的效果。然而,对于图像超分辨重建,接下来的重点研究问题是对自然图像块确定最优的字典大小,并将其与压缩感知的理论更加紧密地联系起来,利用其找到合适的图像块大小和训练字典对的合适方法。
附:由于博客上传图片容量大小的限制,论文的部分实验结果图片本未放上来。
杨建超大牛主页:http://www.ifp.illinois.edu/~jyang29/

PS:对稀疏表示与图像超分辨率技术感兴趣的朋友,请加图像超分辨率技术交流讨论群:

前言
最后更新于:2022-04-01 14:29:32
> 原文出处:[图像超分辨率技术](http://blog.csdn.net/column/details/imagesuperresolution.html)
作者:[geekmanong](http://blog.csdn.net/geekmanong)
**本系列文章经作者授权在看云整理发布,未经作者允许,请勿转载!**
# 图像超分辨率技术
> 图像超分辨率(Image Super Resolution)是指由一幅低分辨率图像或图像序列恢复出高分辨率图像。图像超分辨率技术分为超分辨率复原和超分辨率重建。目前, 图像超分辨率研究可分为 3个主要范畴: 基于插值、 基于重建和基于学习的方法.