3.6 scikit-learn:Python中的机器学习
最后更新于:2022-04-01 11:22:08
# 3.6 scikit-learn:Python中的机器学习
In [5]:
```
%matplotlib inline
import numpy as np
```
> 作者: Fabian Pedregosa, Gael Varoquaux
**先决条件**
Numpy, Scipy
IPython
matplotlib
scikit-learn ([http://scikit-learn.org](http://scikit-learn.org)) 
**章节内容**
```
加载样例数据集
- 学习与预测
分类
- KNN分类器
- 分类的支持向量机(SVMs)
聚类:将观察值聚集在一起
- K-means聚类
使用主成分分析的降维
把所有都放在一起:面孔识别
线性模型:从回归到简约
- 简约模型
模型选择:选择预测器和参数
- 网格搜索和交叉验证预测器
```
**警告**:从版本0.9(在2011年9月发布)起,scikit-learn导入路径从scikits.learn 改为 sklearn
## 3.5.1 加载样例数据集

首先,我们将加载一些数据来玩玩。我们将使用的数据是知名的非常简单的花数据鸢尾花数据集。
我们有150个鸢尾花观察值指定了一些测量:花萼宽带、花萼长度、花瓣宽度和花瓣长度,以及对应的子类:Iris setosa、Iris versicolor和Iris virginica。
将数据集加载为Python对象:
In [1]:
```
from sklearn import datasets
iris = datasets.load_iris()
```
这个数据存储在`.data`成员中,是一个 (n_samples, n_features) 数组。
In [2]:
```
iris.data.shape
```
Out[2]:
```
(150, 4)
```
每个观察的类别存储在数据集的`.target`属性中。这是长度是n_samples的1D整型数组 :
In [3]:
```
iris.target.shape
```
Out[3]:
```
(150,)
```
In [4]:
```
import numpy as np
np.unique(iris.target)
```
Out[4]:
```
array([0, 1, 2])
```
数据重排的例子:digits 数据集 
digits 数据集包含1797 图像,每一个是8X8像素的图片,代表一个手写的数字
In [15]:
```
digits = datasets.load_digits()
digits.images.shape
```
Out[15]:
```
(1797, 8, 8)
```
In [8]:
```
import pylab as pl
pl.imshow(digits.images[0], cmap=pl.cm.gray_r)
```
Out[8]:
```
<matplotlib.image.AxesImage at 0x109abd990>
```
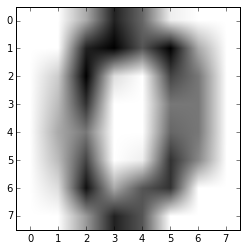
要在scikit使用这个数据集,我们将每个8X8图片转化为一个长度为64的向量
In [9]:
```
data = digits.images.reshape((digits.images.shape[0], -1))
```
### 3.5.1.1 学习和预测
现在我们有了一些数据,我们想要从上面学习并且在新的数据做预测。在scikit-learn中,我们通过创建一个预测器,并调用他的 fit(X, Y) 方法从现有数据上学习。
In [11]:
```
from sklearn import svm
clf = svm.LinearSVC()
clf.fit(iris.data, iris.target) # 从数据学习
```
Out[11]:
```
LinearSVC(C=1.0, class_weight=None, dual=True, fit_intercept=True,
intercept_scaling=1, loss='squared_hinge', max_iter=1000,
multi_class='ovr', penalty='l2', random_state=None, tol=0.0001,
verbose=0)
```
一旦我们从数据中学习,我们可以用我们的模型来预测未见过的数据的最可能输出:
In [12]:
```
clf.predict([[ 5.0, 3.6, 1.3, 0.25]])
```
Out[12]:
```
array([0])
```
**注意**:我们可以通过由下滑线结尾的属性来访问模型的参数:
In [13]:
```
clf.coef_
```
Out[13]:
```
array([[ 0.18424728, 0.45122657, -0.80794162, -0.45070597],
[ 0.05691797, -0.89245895, 0.39682582, -0.92882381],
[-0.85072494, -0.98678239, 1.38091241, 1.86550868]])
```
## 3.5.2 分类
### 3.5.2.1 KNN分类器

可能最简单的分类器是最接近的邻居: 给定一个观察,使用在N维空间中训练样例中最接近它标签,这里N是每个样例的特征数。
K个最临近的邻居分类器内部使用基于ball tree的算法,用来代表训练的样例。
**KNN (K个最临近邻居) 分类的例子:**
In [14]:
```
# 创建并拟合一个最临近邻居分类器
from sklearn import neighbors
knn = neighbors.KNeighborsClassifier()
knn.fit(iris.data, iris.target)
```
Out[14]:
```
KNeighborsClassifier(algorithm='auto', leaf_size=30, metric='minkowski',
metric_params=None, n_neighbors=5, p=2, weights='uniform')
```
In [15]:
```
knn.predict([[0.1, 0.2, 0.3, 0.4]])
```
Out[15]:
```
array([0])
```
**训练集和测试集**
当用学习算法进行实验时,重要的一点是不要用拟合预测器的数据来测试预测器的预测力。实际上,我们通常会在测试集上得到准确的预测。
In [16]:
```
perm = np.random.permutation(iris.target.size)
iris.data = iris.data[perm]
iris.target = iris.target[perm]
knn.fit(iris.data[:100], iris.target[:100])
```
Out[16]:
```
KNeighborsClassifier(algorithm='auto', leaf_size=30, metric='minkowski',
metric_params=None, n_neighbors=5, p=2, weights='uniform')
```
In [17]:
```
knn.score(iris.data[100:], iris.target[100:])
```
Out[17]:
```
0.95999999999999996
```
额外的问题: 为什么我们使用随机排列?
### 3.5.2.2 分类的支持向量机 (SVMs))
#### 3.5.2.2.1 线性支持向量机

SVMs试图构建一个最大化两个类的间距的超平面。它选取输入的一个子集,称为支持向量,这个子集中的观察距离分隔超平面最近。
In [18]:
```
from sklearn import svm
svc = svm.SVC(kernel='linear')
svc.fit(iris.data, iris.target)
```
Out[18]:
```
SVC(C=1.0, cache_size=200, class_weight=None, coef0=0.0, degree=3, gamma=0.0,
kernel='linear', max_iter=-1, probability=False, random_state=None,
shrinking=True, tol=0.001, verbose=False)
```
在scikit-learn实现了几种支持向量机。最常用的是`svm.SVC`、`svm.NuSVC` 和 `svm.LinearSVC`; “SVC” 代表支持向量分类器 (也存在用于回归的SVMs, 在scikit-learn被称为“SVR”)。
**练习**
在digits数据集上训练`svm.SVC`。留下最后的10%,在这些观察上测试预测的效果。
#### 3.5.2.2.2 使用核 (kernel))
类通常并不是都能用超平面分隔,因此,有一个不仅仅是线性也可能是多项式或者幂的决策函数是明智的 :
**线性核 (kernel)** 
In [19]:
```
svc = svm.SVC(kernel='linear')
```
**多项式核 (kernel)** 
In [20]:
```
svc = svm.SVC(kernel='poly', degree=3)
# degree: 多项式的阶
```
**RBF核 (kernel) (径向基核函数)** 
In [21]:
```
svc = svm.SVC(kernel='rbf')
# gamma: 径向基核大小的倒数
```
**练习** 以上列出的核哪一个在digits数据集上有较好的预测表现?
## 3.5.3 聚类 : 将观察值分组
以鸢尾花 (iris) 数据集为例,如果有三类鸢尾花,但是并不能访问他们标签,我们可以尝试**非观察学习** : 通过一些标准将观察**聚类**分入一些组。
### 3.5.3.1 K-means 聚类
最简单的聚类算法是k-means。这个算法将集合分成k个组,将每个观察值分配给一个组,以便使观察值 (在n维空间) 到组平均值的距离最小;然后重新计算平均数。循环进行这个操作直到组收敛,比如达到最大的`max_iter`循环次数。
(k-means的另一个实现在SciPy的`cluster`包中。`scikit-learn`实现的不同在于提供了一个对象API和一些额外的功能,包括智能初始化。)
In [2]:
```
from sklearn import cluster, datasets
iris = datasets.load_iris()
k_means = cluster.KMeans(n_clusters=3)
k_means.fit(iris.data)
```
Out[2]:
```
KMeans(copy_x=True, init='k-means++', max_iter=300, n_clusters=3, n_init=10,
n_jobs=1, precompute_distances='auto', random_state=None, tol=0.0001,
verbose=0)
```
In [25]:
```
print k_means.labels_[::10]
```
```
[0 0 0 0 0 1 1 1 1 1 2 2 2 2 2]
```
In [26]:
```
print iris.target[::10]
```
```
[0 0 0 0 0 1 1 1 1 1 2 2 2 2 2]
```
**真实情况**
 **K-means (3 组)**
 **K-means (8 组)**

**在图像压缩中的应用**
聚类可以看做从信息中选取一组观察的方式。例如,这个技术可以被用来posterize一个图像 (将连续渐变色调转换为更少色调的一些区域):
In [5]:
```
from scipy import misc
lena = misc.lena().astype(np.float32)
X = lena.reshape((-1, 1)) # We need an (n_sample, n_feature) array
k_means = cluster.KMeans(n_clusters=5)
k_means.fit(X)
```
Out[5]:
```
KMeans(copy_x=True, init='k-means++', max_iter=300, n_clusters=5, n_init=10,
n_jobs=1, precompute_distances='auto', random_state=None, tol=0.0001,
verbose=0)
```
In [6]:
```
values = k_means.cluster_centers_.squeeze()
labels = k_means.labels_
lena_compressed = np.choose(labels, values)
lena_compressed.shape = lena.shape
```
源图片

K-means quantization

## 3.5.4 使用主成分分析的降维


上面观察展开的云点在一个方向非常平坦,因此,一个特征几乎可以准确用另两个特征来计算。PCA找到数据并不平坦的方向,并且可以通过投影到一个子空间中来减少维度。
**警告**: 根据你的scikit-learn版本,PCA将在模块`decomposition`或`pca`中。
In [3]:
```
from sklearn import decomposition
pca = decomposition.PCA(n_components=2)
pca.fit(iris.data)
```
Out[3]:
```
PCA(copy=True, n_components=2, whiten=False)
```
In [4]:
```
X = pca.transform(iris.data)
```
现在我们可视化(转换的)鸢尾花数据集:
In [6]:
```
import pylab as pl
pl.scatter(X[:, 0], X[:, 1], c=iris.target)
```
Out[6]:
```
<matplotlib.collections.PathCollection at 0x107502b90>
```
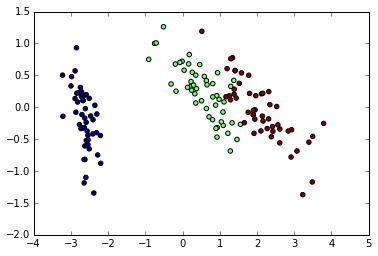
PCA并不仅仅在高纬度数据集的可视化上有用。它也可以用于帮助加速对高维不太高效的有监督方法的预处理步骤。
## 3.5.5 把所有的东西放在一起: 面孔识别
展示使用主成分分析来降维和用执行向量机分类的面孔识别的例子。

In [ ]:
```
"""
Stripped-down version of the face recognition example by Olivier Grisel
http://scikit-learn.org/dev/auto_examples/applications/face_recognition.html
## original shape of images: 50, 37
"""
import numpy as np
import pylab as pl
from sklearn import cross_val, datasets, decomposition, svm
# ..
# .. load data ..
lfw_people = datasets.fetch_lfw_people(min_faces_per_person=70, resize=0.4)
perm = np.random.permutation(lfw_people.target.size)
lfw_people.data = lfw_people.data[perm]
lfw_people.target = lfw_people.target[perm]
faces = np.reshape(lfw_people.data, (lfw_people.target.shape[0], -1))
train, test = iter(cross_val.StratifiedKFold(lfw_people.target, k=4)).next()
X_train, X_test = faces[train], faces[test]
y_train, y_test = lfw_people.target[train], lfw_people.target[test]
# ..
# .. dimension reduction ..
pca = decomposition.RandomizedPCA(n_components=150, whiten=True)
pca.fit(X_train)
X_train_pca = pca.transform(X_train)
X_test_pca = pca.transform(X_test)
# ..
# .. classification ..
clf = svm.SVC(C=5., gamma=0.001)
clf.fit(X_train_pca, y_train)
# ..
# .. predict on new images ..
for i in range(10):
print lfw_people.target_names[clf.predict(X_test_pca[i])[0]]
_ = pl.imshow(X_test[i].reshape(50, 37), cmap=pl.cm.gray)
_ = raw_input()
```
完整代码: [faces.py](http://scipy-lectures.github.io/_downloads/faces.py)
## 3.5.6 线性模型: 从回归到简约
**糖尿病数据集** 糖尿病数据集包含442个病人测量的10个生理学变量 (年龄、性别、体重、血压),以及一个一年后病情发展的标记:
In [8]:
```
diabetes = datasets.load_diabetes()
diabetes_X_train = diabetes.data[:-20]
diabetes_X_test = diabetes.data[-20:]
diabetes_y_train = diabetes.target[:-20]
diabetes_y_test = diabetes.target[-20:]
```
目前的任务是从生理学变量中预测疾病发生。
### 3.5.6.1 简约模型
要改善问题的条件 (信息量小的变量、减少高纬度的诅咒、作为一个特征预处理等等), 仅选择信息量大的特征,并且将没有信息量的特征设置为0将非常有趣。这种惩罚手段,称为**Lasso**, 可以将一些系数设置为0。这个方法称为**简约方法**,简约性可以看做是Occam剃刀的一个应用: 相比于复杂的模型更偏好简单的模型。
In [9]:
```
from sklearn import linear_model
regr = linear_model.Lasso(alpha=.3)
regr.fit(diabetes_X_train, diabetes_y_train)
```
Out[9]:
```
Lasso(alpha=0.3, copy_X=True, fit_intercept=True, max_iter=1000,
normalize=False, positive=False, precompute=False, random_state=None,
selection='cyclic', tol=0.0001, warm_start=False)
```
In [10]:
```
regr.coef_ # 非常简约的系数
```
Out[10]:
```
array([ 0\. , -0\. , 497.34075682, 199.17441034,
-0\. , -0\. , -118.89291545, 0\. ,
430.9379595 , 0\. ])
```
In [11]:
```
regr.score(diabetes_X_test, diabetes_y_test)
```
Out[11]:
```
0.55108354530029779
```
分数与线性回归 (最小二乘) 很相似:
In [12]:
```
lin = linear_model.LinearRegression()
lin.fit(diabetes_X_train, diabetes_y_train)
```
Out[12]:
```
LinearRegression(copy_X=True, fit_intercept=True, n_jobs=1, normalize=False)
```
In [13]:
```
lin.score(diabetes_X_test, diabetes_y_test)
```
Out[13]:
```
0.58507530226905713
```
**相同问题的不同算法** 不同的算法可以用于解决相同的数学问题。例如,_sklearn_中的Lasso对象用_坐标下降法_来解lasso回归,这种方法在大数据集上有效。但是,_sklearn_也提供了_LassoLARS_对象,使用_LARS_,一种在权重向量估计非常稀疏的问题上非常高效的方法,即有很少观察值的问题。
## 3.5.7 模型选择: 选择预测器及其参数
### 3.5.7.1 网格搜索和交叉验证预测器
#### 3.5.7.1.1 网格搜索
scikit-learn提供了一个对象,给定数据,计算预测器在一个参数网格的分数,并且选择可以最大化交叉验证分数的参数。这个对象用一个构建中的预测器并且暴露了一个预测器的探索集API:
In [16]:
```
from sklearn import svm, grid_search
gammas = np.logspace(-6, -1, 10)
svc = svm.SVC()
clf = grid_search.GridSearchCV(estimator=svc, param_grid=dict(gamma=gammas), n_jobs=-1)
clf.fit(digits.data[:1000], digits.target[:1000])
```
Out[16]:
```
GridSearchCV(cv=None, error_score='raise',
estimator=SVC(C=1.0, cache_size=200, class_weight=None, coef0=0.0, degree=3, gamma=0.0,
kernel='rbf', max_iter=-1, probability=False, random_state=None,
shrinking=True, tol=0.001, verbose=False),
fit_params={}, iid=True, loss_func=None, n_jobs=-1,
param_grid={'gamma': array([ 1.00000e-06, 3.59381e-06, 1.29155e-05, 4.64159e-05,
1.66810e-04, 5.99484e-04, 2.15443e-03, 7.74264e-03,
2.78256e-02, 1.00000e-01])},
pre_dispatch='2*n_jobs', refit=True, score_func=None, scoring=None,
verbose=0)
```
In [20]:
```
clf.best_score_
```
Out[20]:
```
0.93200000000000005
```
In [22]:
```
clf.best_estimator_.gamma
```
Out[22]:
```
0.00059948425031894088
```
默认,_GridSearchCV_使用三折交叉验证。但是,如果识别传递了一个分类器都不是一个回归器,它将使用一个分层三折。
#### 3.5.7.1.2 交叉验证预测器
一个算法一个算法为基础的设置参数来进行交叉验证更有效。这也就是为什么,对于一些预测器,scikit-learn暴露一个“CV”预测器, 这个预测器通过交叉验证自动设置他们的参数:
In [23]:
```
from sklearn import linear_model, datasets
lasso = linear_model.LassoCV()
diabetes = datasets.load_diabetes()
X_diabetes = diabetes.data
y_diabetes = diabetes.target
lasso.fit(X_diabetes, y_diabetes)
```
Out[23]:
```
LassoCV(alphas=None, copy_X=True, cv=None, eps=0.001, fit_intercept=True,
max_iter=1000, n_alphas=100, n_jobs=1, normalize=False, positive=False,
precompute='auto', random_state=None, selection='cyclic', tol=0.0001,
verbose=False)
```
In [26]:
```
# 预测器自动选择他的lambda:
lasso.alpha_
```
Out[26]:
```
0.012291895087486173
```
这些预测器与他们的对等物调用方式类似,只是在名字后面增加了‘CV’。
**练习** 在糖尿病数据集中,找到最优化的正则化参数alpha。
3.5 使用Mayavi进行3D作图
最后更新于:2022-04-01 11:22:05
# 3.5 使用Mayavi进行3D作图
3.4 Traits:创建交互对话
最后更新于:2022-04-01 11:22:03
# 3.4 Traits:创建交互对话
In [10]:
```
%matplotlib inline
import numpy as np
```
> 作者 : _Didrik Pinte_
Traits项目允许你可以向Python项目属性方便的添加验证、初始化、委托、通知和图形化界面。
在这个教程中,我们将研究Traits工具包并且学习如何动态减少你所写的锅炉片代码,进行快速的GUI应用开发,以及理解Enthought工具箱中其他部分的想法。
Traits和Enthought工具箱是基于BSD-style证书的开源项目。
**目标受众**
## Python中高级程序员
**要求**
* [wxPython](http://www.wxpython.org/)、[PyQt](https://riverbankcomputing.com/software/pyqt/intro)或[PySide](https://pyside.github.io/docs/pyside/)之一
* Numpy和Scipy
* [Enthought工具箱](http://code.enthought.com/projects)
* 所有需要的软件都可以通过安装[EPD免费版](https://store.enthought.com/)来获得
**教程内容**
* 介绍
* 例子
* Traits是什么
* 初始化
* 验证
* 文档
* 可视化: 打开一个对话框
* 推迟
* 通知
* 一些更高级的特征
## 3.4.1 介绍
Enthought工具箱可以构建用于数据分析、2D绘图和3D可视化的精密应用框架。这些强力可重用的组块是在BSD-style证书下发布的。
Enthought工具箱主要的包是:
* Traits - 基于组块的方式构建我们的应用。
* Kiva - 2D原生支持基于路径的rendering、affine转化、alpha混合及其它。
* Enable - 基于对象的2D绘图画布。
* Chaco - 绘图工具箱,用于构建复杂的交互2D图像。
* Mayavi -基于VTK的3D科学数据可视化
* Envisage - 应用插件框架,用于构建脚本化可扩展的应用

在这篇教程中,我们将关注Traits。
## 3.4.2 例子
在整个这篇教程中,我们将使用基于水资源管理简单案例的一个样例。我们将试着建模一个水坝和水库系统。水库和水坝有下列参数:
* 名称
* 水库的最小和最大容量 [$hm^3$]
* 水坝的高度和宽度[$m$]
* 蓄水面积[$km^2$]
* 水压头[$m$]
* 涡轮的动力[$MW$]
* 最小和最大放水量[$m^3/s$]
* 涡轮的效率
水库有一个已知的运转情况。一部分是与基于放水量有关的能量产生。估算水力发电机电力生产的简单公式是$P = \rho hrgk$, 其中
* P 以瓦特为单位的功率,
* \rho 是水的密度 ($~1000 kg/m^3$),
* h 是水的高度,
* r 是以每秒立方米为单位的流动率,
* g 重力加速度,9.8 $m/s^2$,
* k 是效率系数,范围从0到1。
年度的电能生产取决于可用的水供给。在一些设施中,水流率在一年中可能差10倍。
运行状态的第二个部分是蓄水量,蓄水量(storage)依赖于控制和非控制参数:
$storage_{t+1} = storage_t + inflows - release - spillage - irrigation$
本教程中使用的数据不是真实的,可能甚至在现实中没有意义。
## 3.4.3 Traits是什么
trait是可以用于常规Python对象属性的类型定义,给出属性的一些额外特性:
* 标准化:
* 初始化
* 验证
* 推迟
* 通知
* 可视化
* 文档
类可以自由混合基于trait的属性与通用Python属性,或者选择允许在这个类中只使用固定的或开放的trait属性集。类定义的Trait属性自动继承自由这个类衍生的其他子类。
创建一个traits类的常用方式是通过扩展**HasTraits**基础类,并且定义类的traits :
In [1]:
```
from traits.api import HasTraits, Str, Float
class Reservoir(HasTraits):
name = Str
max_storage = Float
```
对Traits 3.x用户来说
如果使用Traits 3.x, 你需要调整traits包的命名空间:
* traits.api应该为enthought.traits.api
* traitsui.api应该为enthought.traits.ui.api
像这样使用traits类和使用其他Python类一样简单。注意,trait值通过关键词参数传递:
In [2]:
```
reservoir = Reservoir(name='Lac de Vouglans', max_storage=605)
```
### 3.4.3.1 初始化
所有的traits都有一个默认值来初始化变量。例如,基础python类型有如下的trait等价物:
| Trait | Python类型 | 内置默认值 |
| --- | --- | --- |
| Bool | Boolean | False |
| Complex | Complex number | 0+0j |
| Float | Floating point number | 0.0 |
| Int | Plain integer | 0 |
| Long | Long integer | 0L |
| Str | String | '' |
| Unicode | Unicode | u'' |
存在很多其他预定义的trait类型: Array, Enum, Range, Event, Dict, List, Color, Set, Expression, Code, Callable, Type, Tuple, etc。
自定义默认值可以在代码中定义:
In [3]:
```
from traits.api import HasTraits, Str, Float
class Reservoir(HasTraits):
name = Str
max_storage = Float(100)
reservoir = Reservoir(name='Lac de Vouglans')
```
复杂初始化
当一个trait需要复杂的初始化时,可以实施_XXX_默认魔法方法。当调用XXX trait时,它会被懒惰的调用。例如:
In [4]:
```
def _name_default(self):
""" Complex initialisation of the reservoir name. """
return 'Undefined'
```
### 3.4.3.2 验证
当用户试图设置trait的内容时,每一个trait都会被验证:
In [5]:
```
reservoir = Reservoir(name='Lac de Vouglans', max_storage=605)
reservoir.max_storage = '230'
```
```
---------------------------------------------------------------------------
TraitError Traceback (most recent call last)
<ipython-input-5-cbed071af0b9> in <module>()
1 reservoir = Reservoir(name='Lac de Vouglans', max_storage=605)
2
----> 3 reservoir.max_storage = '230'
/Library/Python/2.7/site-packages/traits/trait_handlers.pyc in error(self, object, name, value)
170 """
171 raise TraitError( object, name, self.full_info( object, name, value ),
--> 172 value ) 173
174 def full_info ( self, object, name, value ):
TraitError: The 'max_storage' trait of a Reservoir instance must be a float, but a value of '230' <type 'str'> was specified.
```
### 3.4.3.3 文档
从本质上说,所有的traits都提供关于模型自身的文档。创建类的声明方式使它是自解释的:
In [6]:
```
from traits.api import HasTraits, Str, Float
class Reservoir(HasTraits):
name = Str
max_storage = Float(100)
```
trait的**desc**元数据可以用来提供关于trait更多的描述信息:
In [7]:
```
from traits.api import HasTraits, Str, Float
class Reservoir(HasTraits):
name = Str
max_storage = Float(100, desc='Maximal storage [hm3]')
```
现在让我们来定义完整的reservoir类:
In [8]:
```
from traits.api import HasTraits, Str, Float, Range
class Reservoir(HasTraits):
name = Str
max_storage = Float(1e6, desc='Maximal storage [hm3]')
max_release = Float(10, desc='Maximal release [m3/s]')
head = Float(10, desc='Hydraulic head [m]')
efficiency = Range(0, 1.)
def energy_production(self, release):
''' Returns the energy production [Wh] for the given release [m3/s]
'''
power = 1000 * 9.81 * self.head * release * self.efficiency
return power * 3600
if __name__ == '__main__':
reservoir = Reservoir(
name = 'Project A',
max_storage = 30,
max_release = 100.0,
head = 60,
efficiency = 0.8
)
release = 80
print 'Releasing {} m3/s produces {} kWh'.format(
release, reservoir.energy_production(release)
)
```
```
Releasing 80 m3/s produces 1.3561344e+11 kWh
```
### 3.4.3.4 可视化: 打开一个对话框
Traits库也关注用户界面,可以弹出一个Reservoir类的默认视图:
In [ ]:
```
reservoir1 = Reservoir()
reservoir1.edit_traits()
```
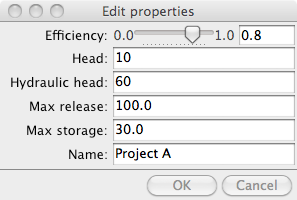
TraitsUI简化了创建用户界面的方式。HasTraits类上的每一个trait都有一个默认的编辑器,将管理trait在屏幕上显示的方式 (即Range trait显示为一个滑块等)。
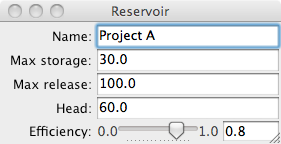
与Traits声明方式来创建类的相同渠道,TraitsUI提供了声明的界面来构建用户界面代码:
In [ ]:
```
from traits.api import HasTraits, Str, Float, Range
from traitsui.api import View
class Reservoir(HasTraits):
name = Str
max_storage = Float(1e6, desc='Maximal storage [hm3]')
max_release = Float(10, desc='Maximal release [m3/s]')
head = Float(10, desc='Hydraulic head [m]')
efficiency = Range(0, 1.)
traits_view = View(
'name', 'max_storage', 'max_release', 'head', 'efficiency',
title = 'Reservoir',
resizable = True,
)
def energy_production(self, release):
''' Returns the energy production [Wh] for the given release [m3/s]
'''
power = 1000 * 9.81 * self.head * release * self.efficiency
return power * 3600
if __name__ == '__main__':
reservoir = Reservoir(
name = 'Project A',
max_storage = 30,
max_release = 100.0,
head = 60,
efficiency = 0.8
)
reservoir.configure_traits()
```
### 3.4.3.5 推迟
可以将trait定义和它的值推送给另一个对象是Traits的有用的功能。
In [ ]:
```
from traits.api import HasTraits, Instance, DelegatesTo, Float, Range
from reservoir import Reservoir
class ReservoirState(HasTraits):
"""Keeps track of the reservoir state given the initial storage.
"""
reservoir = Instance(Reservoir, ())
min_storage = Float
max_storage = DelegatesTo('reservoir')
min_release = Float
max_release = DelegatesTo('reservoir')
# state attributes
storage = Range(low='min_storage', high='max_storage')
# control attributes
inflows = Float(desc='Inflows [hm3]')
release = Range(low='min_release', high='max_release')
spillage = Float(desc='Spillage [hm3]')
def print_state(self):
print 'Storage\tRelease\tInflows\tSpillage'
str_format = '\t'.join(['{:7.2f}'for i in range(4)])
print str_format.format(self.storage, self.release, self.inflows,
self.spillage)
print '-' * 79
if __name__ == '__main__':
projectA = Reservoir(
name = 'Project A',
max_storage = 30,
max_release = 100.0,
hydraulic_head = 60,
efficiency = 0.8
)
state = ReservoirState(reservoir=projectA, storage=10)
state.release = 90
state.inflows = 0
state.print_state()
print 'How do we update the current storage ?'
```
特殊的trait允许用魔法_xxxx_fired方法管理事件和触发器函数:
In [ ]:
```
from traits.api import HasTraits, Instance, DelegatesTo, Float, Range, Event
from reservoir import Reservoir
class ReservoirState(HasTraits):
"""Keeps track of the reservoir state given the initial storage.
For the simplicity of the example, the release is considered in
hm3/timestep and not in m3/s.
"""
reservoir = Instance(Reservoir, ())
min_storage = Float
max_storage = DelegatesTo('reservoir')
min_release = Float
max_release = DelegatesTo('reservoir')
# state attributes
storage = Range(low='min_storage', high='max_storage')
# control attributes
inflows = Float(desc='Inflows [hm3]')
release = Range(low='min_release', high='max_release')
spillage = Float(desc='Spillage [hm3]')
update_storage = Event(desc='Updates the storage to the next time step')
def _update_storage_fired(self):
# update storage state
new_storage = self.storage - self.release + self.inflows
self.storage = min(new_storage, self.max_storage)
overflow = new_storage - self.max_storage
self.spillage = max(overflow, 0)
def print_state(self):
print 'Storage\tRelease\tInflows\tSpillage'
str_format = '\t'.join(['{:7.2f}'for i in range(4)])
print str_format.format(self.storage, self.release, self.inflows,
self.spillage)
print '-' * 79
if __name__ == '__main__':
projectA = Reservoir(
name = 'Project A',
max_storage = 30,
max_release = 5.0,
hydraulic_head = 60,
efficiency = 0.8
)
state = ReservoirState(reservoir=projectA, storage=15)
state.release = 5
state.inflows = 0
# release the maximum amount of water during 3 time steps
state.update_storage = True
state.print_state()
state.update_storage = True
state.print_state()
state.update_storage = True
state.print_state()
```
对象间的依赖可以自动使用trait**Property**完成。**depends_on**属性表示property其他traits的依赖性。当其他traits改变了,property是无效的。此外,Traits为属性使用魔法函数的名字:
* _get_XXX 来获得XXX属性的trait
* _set_XXX 来设置XXX属性的trait
In [ ]:
```
from traits.api import HasTraits, Instance, DelegatesTo, Float, Range
from traits.api import Property
from reservoir import Reservoir
class ReservoirState(HasTraits):
"""Keeps track of the reservoir state given the initial storage.
For the simplicity of the example, the release is considered in
hm3/timestep and not in m3/s.
"""
reservoir = Instance(Reservoir, ())
max_storage = DelegatesTo('reservoir')
min_release = Float
max_release = DelegatesTo('reservoir')
# state attributes
storage = Property(depends_on='inflows, release')
# control attributes
inflows = Float(desc='Inflows [hm3]')
release = Range(low='min_release', high='max_release')
spillage = Property(
desc='Spillage [hm3]', depends_on=['storage', 'inflows', 'release']
)
### Private traits.
_storage = Float
### Traits property implementation.
def _get_storage(self):
new_storage = self._storage - self.release + self.inflows
return min(new_storage, self.max_storage)
def _set_storage(self, storage_value):
self._storage = storage_value
def _get_spillage(self):
new_storage = self._storage - self.release + self.inflows
overflow = new_storage - self.max_storage
return max(overflow, 0)
def print_state(self):
print 'Storage\tRelease\tInflows\tSpillage'
str_format = '\t'.join(['{:7.2f}'for i in range(4)])
print str_format.format(self.storage, self.release, self.inflows,
self.spillage)
print '-' * 79
if __name__ == '__main__':
projectA = Reservoir(
name = 'Project A',
max_storage = 30,
max_release = 5,
hydraulic_head = 60,
efficiency = 0.8
)
state = ReservoirState(reservoir=projectA, storage=25)
state.release = 4
state.inflows = 0
state.print_state()
```
**注意** 缓存属性 当访问一个输入没有改变的属性时,[[email protected]](/cdn-cgi/l/email-protection)_property修饰器可以用来缓存这个值,并且只有在失效时才会重新计算一次他们。
让我们用ReservoirState的例子来扩展TraitsUI介绍:
In [ ]:
```
from traits.api import HasTraits, Instance, DelegatesTo, Float, Range, Property
from traitsui.api import View, Item, Group, VGroup
from reservoir import Reservoir
class ReservoirState(HasTraits):
"""Keeps track of the reservoir state given the initial storage.
For the simplicity of the example, the release is considered in
hm3/timestep and not in m3/s.
"""
reservoir = Instance(Reservoir, ())
name = DelegatesTo('reservoir')
max_storage = DelegatesTo('reservoir')
max_release = DelegatesTo('reservoir')
min_release = Float
# state attributes
storage = Property(depends_on='inflows, release')
# control attributes
inflows = Float(desc='Inflows [hm3]')
release = Range(low='min_release', high='max_release')
spillage = Property(
desc='Spillage [hm3]', depends_on=['storage', 'inflows', 'release']
)
### Traits view
traits_view = View(
Group(
VGroup(Item('name'), Item('storage'), Item('spillage'),
label = 'State', style = 'readonly'
),
VGroup(Item('inflows'), Item('release'), label='Control'),
)
)
### Private traits.
_storage = Float
### Traits property implementation.
def _get_storage(self):
new_storage = self._storage - self.release + self.inflows
return min(new_storage, self.max_storage)
def _set_storage(self, storage_value):
self._storage = storage_value
def _get_spillage(self):
new_storage = self._storage - self.release + self.inflows
overflow = new_storage - self.max_storage
return max(overflow, 0)
def print_state(self):
print 'Storage\tRelease\tInflows\tSpillage'
str_format = '\t'.join(['{:7.2f}'for i in range(4)])
print str_format.format(self.storage, self.release, self.inflows,
self.spillage)
print '-' * 79
if __name__ == '__main__':
projectA = Reservoir(
name = 'Project A',
max_storage = 30,
max_release = 5,
hydraulic_head = 60,
efficiency = 0.8
)
state = ReservoirState(reservoir=projectA, storage=25)
state.release = 4
state.inflows = 0
state.print_state()
state.configure_traits()
```
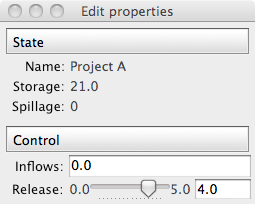
Some use cases need the delegation mechanism to be broken by the user when setting the value of the trait. The PrototypeFrom trait implements this behaviour.
In [ ]:
```
TraitsUI simplifies the way user interfaces are created. Every trait on a HasTraits class has a default editor that will manage the way the trait is rendered to the screen (e.g. the Range trait is displayed as a slider, etc.).
In the very same vein as the Traits declarative way of creating classes, TraitsUI provides a declarative interface to build user interfaces code:
```
3.3 Scikit-image:图像处理
最后更新于:2022-04-01 11:22:01
# 3.3 Scikit-image:图像处理
> **作者**: Emmanuelle Gouillart
[scikit-image](http://scikit-image.org/)是专注于图像处理的Python包,并且使用原生的Numpy数组作为图像对象。本章描述如何在不同图像处理任务上使用`scikit-image`,并且保留了其他科学Python模块比如Numpy和Scipy的链接。
**也可以看一下:**对于基本图像处理,比如图像剪切或者简单过滤,大量简单操作可以用Numpy和SciPy来实现。看一下[使用Numpy和Scipy图像操作和处理部分](http://www.scipy-lectures.org/advanced/image_processing/index.html#basic-image)。
注意,在阅读本章之前你应该熟悉前面章节的内容,比如基础操作,比如面具和标签作为先决条件。
**章节内容**
* **介绍和观点**
* `scikit-image` 和 `SciPy`生态系统
* `scikit-image`能发现什么
* **输入/输出, 数据类型和 颜色空间**
* 数据类型
* 颜色空间
* **图像预处理/增强**
* 本地过滤器
* 非-本地过滤器
* 数学形态学
* **图像细分**
* 二元细分: 前景 + 背景
* 基于标记的方法
* **测量区域的属性**
* **数据可视化和交互**
## 3.3.1 介绍和观点
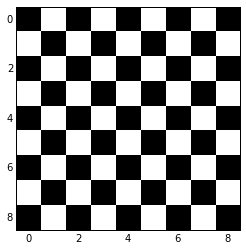
图像是NumPy的数组`np.ndarray`
| 图像: | np.ndarray |
| --- | --- |
| 像素: | array values: a[2, 3] |
| 渠道: | array dimensions |
| 图像编码: | dtype (np.uint8, np.uint16, np.float) |
| 过滤器: | functions (numpy, skimage, scipy) |
In [1]:
```
%matplotlib inline
import numpy as np
check = np.zeros((9, 9))
check[::2, 1::2] = 1
check[1::2, ::2] = 1
import matplotlib.pyplot as plt
plt.imshow(check, cmap='gray', interpolation='nearest')
```
Out[1]:
```
<matplotlib.image.AxesImage at 0x105717610>
```
### 3.3.1.1 scikit-image 和 SciPy 生态系统
最新版的`scikit-image`包含在大多数的科学Python发行版中,比如,Anaconda或Enthought Canopy。它也包含在 Ubuntu/Debian。
In [6]:
```
import skimage
from skimage import data # 大多数函数在子包中
```
大多数`scikit-image`函数用NumPy ndarrays作为参数
In [6]:
```
camera = data.camera()
camera.dtype
```
Out[6]:
```
dtype('uint8')
```
In [7]:
```
camera.shape
```
Out[7]:
```
(512, 512)
```
In [8]:
```
from skimage import restoration
filtered_camera = restoration.denoise_bilateral(camera)
type(filtered_camera)
```
Out[8]:
```
numpy.ndarray
```
其他Python包也可以用于图像处理,并且使用Numpy数组:
* [scipy.ndimage](http://docs.scipy.org/doc/scipy/reference/ndimage.html#module-scipy.ndimage) : 对于 nd-arrays。基础过滤、数学形态学和区域属性
* [Mahotas](http://luispedro.org/software/mahotas) 同时,强大的图形处理库有Python封装:
* [OpenCV](https://opencv-python-tutroals.readthedocs.org/en/latest/) (计算机视觉)
* [ITK](http://www.itk.org/itkindex.html) (3D图像和注册)
* 其他 (但是,他们没有那么Pythonic也没有Numpy友好,在一定范围)。
### 3.3.1.2 scikit-image能发现什么
* 网站: [http://scikit-image.org/](http://scikit-image.org/)
* 例子库 (就像在 [matplotlib](http://matplotlib.org/gallery.html) 或 [scikit-learn](http://scikit-learn.org/)): [http://scikit-image.org/docs/stable/auto_examples/](http://scikit-image.org/docs/stable/auto_examples/) 不同类的函数,从基本的使用函数到高级最新算法。
* 过滤器: 函数将图像转化为其他图像。
* NumPy组件
* 通用过滤器算法
* 数据简化函数: 计算图像直方图、局部极值位置、角。
* 其他动作: I/O, 可视化,等。
## 3.3.2 输入/输出, 数据类型和颜色空间
I/O: [skimage.io](http://scikit-image.org/docs/stable/api/skimage.io.html#module-skimage.io)
In [4]:
```
from skimage import io
```
读取文件: [skimage.io.imread()](http://scikit-image.org/docs/stable/api/skimage.io.html#skimage.io.imread)
In [7]:
```
import os
filename = os.path.join(skimage.data_dir, 'camera.png')
camera = io.imread(filename)
```

支持所有被Python Imaging Library(或者`imread` `plugin`关键词提供的任何I/O插件)的数据格式。 也支持URL图片路径:
In [3]:
```
logo = io.imread('http://scikit-image.org/_static/img/logo.png')
```
存储文件:
In [4]:
```
io.imsave('local_logo.png', logo)
```
(`imsave`也用外部插件比如PIL)
### 3.3.2.1 数据类型

图像ndarrays可以用整数(有符号或无符号)或浮点来代表。
小心整数类型的溢出
In [8]:
```
camera = data.camera()
camera.dtype
```
Out[8]:
```
dtype('uint8')
```
In [8]:
```
camera_multiply = 3 * camera
```
可用不同的整型大小: 8-, 16- 或 32-字节, 有符号或无符号。
一个重要的 (如果有疑问的话) `skimage` **惯例**: 图像浮点支持在[-1, 1] (与所以浮点图像相对)
In [9]:
```
from skimage import img_as_float
camera_float = img_as_float(camera)
camera.max(), camera_float.max()
```
Out[9]:
```
(255, 1.0)
```
一些图像处理程序需要应用在浮点数组上,因此,输出的数组可能类型和数据范围都与输入数组不同
In [9]:
```
try:
from skimage import filters
except ImportError:
from skimage import filter as filters
camera_sobel = filters.sobel(camera)
camera_sobel.max()
```
Out[9]:
```
0.5915023652179584
```
在上面的例子中,我们使用`scikit-image`的子模块`filters`,在0.11到0.10版本间,`filter`被重命名为`filters`,为了避免与Python内置的`filter`冲突。
在[skimage](http://scikit-image.org/docs/stable/api/skimage.html#module-skimage)提供了下列skimage实用的函数来转化dtype和data range: `util.img_as_float`、 `util.img_as_ubyte`等。
看一下[用户手册](http://scikit-image.org/docs/stable/user_guide/data_types.html)来了解细节。
In [ ]:
```
An important (if questionable) skimage convention: float images are supposed to lie in [-1, 1] (in order to have comparable contrast for all float images)
```
In [ ]:
```
3.3.1. Introduction and concepts
Images are NumPy’s arrays np.ndarray
```
3.2 Sympy:Python中的符号数学
最后更新于:2022-04-01 11:21:59
# 3.2 Sympy:Python中的符号数学
> **作者** : Fabian Pedregosa
**目的**
* 从任意的精度评估表达式。
* 在符号表达式上进行代数运算。
* 用符号表达式进行基本的微积分任务 (极限、微分法和积分法)。
* 求解多项式和超越方程。
* 求解一些微分方程。
为什么是SymPy? SymPy是符号数学的Python库。它的目的是成为Mathematica或Maple等系统的替代品,同时让代码尽可能简单并且可扩展。SymPy完全是用Python写的,并不需要外部的库。
Sympy文档及库安装见[http://www.sympy.org/](http://www.sympy.org/)
**章节内容**
* SymPy第一步
* 使用SymPy作为计算器
* 练习
* 符号
* 代数运算
* 展开
* 化简
* 微积分
* 极限
* 微分法
* 序列扩展
* 积分法
* 练习
* 方程求解
* 练习
* 线性代数
* 矩阵
* 微分方程
## 3.2.1 SymPy第一步
### 3.2.1.1 使用SymPy作为计算器
SymPy定义了三种数字类型:实数、有理数和整数。
有理数类将有理数表征为两个整数对: 分子和分母,因此Rational(1,2)代表1/2, Rational(5,2)代表5/2等等:
In [2]:
```
from sympy import *
a = Rational(1,2)
```
In [2]:
```
a
```
Out[2]:
```
1/2
```
In [3]:
```
a*2
```
Out[3]:
```
1
```
SymPy在底层使用mpmath, 这使它可以用任意精度的算术进行计算。这样,一些特殊的常数,比如e, pi, oo (无限), 可以被作为符号处理并且可以以任意精度来评估:
In [4]:
```
pi**2
```
Out[4]:
```
pi**2
```
In [5]:
```
pi.evalf()
```
Out[5]:
```
3.14159265358979
```
In [6]:
```
(pi + exp(1)).evalf()
```
Out[6]:
```
5.85987448204884
```
如你所见,将表达式评估为浮点数。
也有一个类代表数学的无限, 称为 oo:
In [7]:
```
oo > 99999
```
Out[7]:
```
True
```
In [8]:
```
oo + 1
```
Out[8]:
```
oo
```
### 3.2.1.2 练习
* 计算 $\sqrt{2}$ 小数点后一百位。
* 用有理数算术计算1/2 + 1/3 in rational arithmetic.
### 3.2.1.3 符号
与其他计算机代数系统不同,在SymPy你需要显性声明符号变量:
In [4]:
```
from sympy import *
x = Symbol('x')
y = Symbol('y')
```
然后你可以计算他们:
In [10]:
```
x + y + x - y
```
Out[10]:
```
2*x
```
In [11]:
```
(x + y)**2
```
Out[11]:
```
(x + y)**2
```
符号可以使用一些Python操作符操作: +, -, *, ** (算术), &, |, ~ , >>, << (布尔逻辑).
**打印** 这里我们使用下列设置打印
In [ ]:
```
sympy.init_printing(use_unicode=False, wrap_line=True)
```
## 3.2.2 代数运算
SymPy可以进行强大的代数运算。我们将看一下最常使用的:展开和化简。
### 3.2.2.1 展开
使用这个模块展开代数表达式。它将试着密集的乘方和相乘:
In [13]:
```
expand((x + y)**3)
```
Out[13]:
```
x**3 + 3*x**2*y + 3*x*y**2 + y**3
```
In [14]:
```
3*x*y**2 + 3*y*x**2 + x**3 + y**3
```
Out[14]:
```
x**3 + 3*x**2*y + 3*x*y**2 + y**3
```
可以通过关键词的形式使用更多的选项:
In [15]:
```
expand(x + y, complex=True)
```
Out[15]:
```
re(x) + re(y) + I*im(x) + I*im(y)
```
In [16]:
```
I*im(x) + I*im(y) + re(x) + re(y)
```
Out[16]:
```
re(x) + re(y) + I*im(x) + I*im(y)
```
In [17]:
```
expand(cos(x + y), trig=True)
```
Out[17]:
```
-sin(x)*sin(y) + cos(x)*cos(y)
```
In [18]:
```
cos(x)*cos(y) - sin(x)*sin(y)
```
Out[18]:
```
-sin(x)*sin(y) + cos(x)*cos(y)
```
## 3.2.2.2 化简
如果可以将表达式转化为更简单的形式,可以使用化简:
In [19]:
```
simplify((x + x*y) / x)
```
Out[19]:
```
y + 1
```
化简是一个模糊的术语,更准确的词应该是:powsimp (指数化简)、 trigsimp (三角表达式)、logcombine、radsimp一起。
**练习**
* 计算$(x+y)^6$的展开。
* 化简三角表达式$ \sin(x) / \cos(x)$
## 3.2.3 微积分
### 3.2.3.1 极限
在SymPy中使用极限很简单,允许语法limit(function, variable, point), 因此要计算f(x)类似$x \rightarrow 0$, 你应该使用limit(f, x, 0):
In [5]:
```
limit(sin(x)/x, x, 0)
```
Out[5]:
```
1
```
你也可以计算一下在无限时候的极限:
In [6]:
```
limit(x, x, oo)
```
Out[6]:
```
oo
```
In [7]:
```
limit(1/x, x, oo)
```
Out[7]:
```
0
```
In [8]:
```
limit(x**x, x, 0)
```
Out[8]:
```
1
```
### 3.2.3.2 微分法
你可以使用`diff(func, var)`微分任何SymPy表达式。例如:
In [9]:
```
diff(sin(x), x)
```
Out[9]:
```
cos(x)
```
In [10]:
```
diff(sin(2*x), x)
```
Out[10]:
```
2*cos(2*x)
```
In [11]:
```
diff(tan(x), x)
```
Out[11]:
```
tan(x)**2 + 1
```
你可以用下列方法检查是否正确:
In [12]:
```
limit((tan(x+y) - tan(x))/y, y, 0)
```
Out[12]:
```
tan(x)**2 + 1
```
可以用`diff(func, var, n)`方法来计算更高的导数:
In [13]:
```
diff(sin(2*x), x, 1)
```
Out[13]:
```
2*cos(2*x)
```
In [14]:
```
diff(sin(2*x), x, 2)
```
Out[14]:
```
-4*sin(2*x)
```
In [15]:
```
diff(sin(2*x), x, 3)
```
Out[15]:
```
-8*cos(2*x)
```
### 3.2.3.3 序列展开
SymPy也知道如何计算一个表达式在一个点的Taylor序列。使用`series(expr, var)`:
In [16]:
```
series(cos(x), x)
```
Out[16]:
```
1 - x**2/2 + x**4/24 + O(x**6)
```
In [17]:
```
series(1/cos(x), x)
```
Out[17]:
```
1 + x**2/2 + 5*x**4/24 + O(x**6)
```
**练习**
计算$\lim_{x\rightarrow 0} \sin(x)/x$
计算`log(x)`对于x的导数。
### 3.2.3.4 积分法
SymPy支持超验基础和特殊函数的无限和有限积分,通过`integrate()` 功能, 使用了强大的扩展的Risch-Norman算法和启发式和模式匹配。你可以积分基本函数:
In [18]:
```
integrate(6*x**5, x)
```
Out[18]:
```
x**6
```
In [19]:
```
integrate(sin(x), x)
```
Out[19]:
```
-cos(x)
```
In [20]:
```
integrate(log(x), x)
```
Out[20]:
```
x*log(x) - x
```
In [21]:
```
integrate(2*x + sinh(x), x)
```
Out[21]:
```
x**2 + cosh(x)
```
也可以很简单的处理特殊函数:
In [22]:
```
integrate(exp(-x**2)*erf(x), x)
```
Out[22]:
```
sqrt(pi)*erf(x)**2/4
```
也可以计算一下有限积分:
In [23]:
```
integrate(x**3, (x, -1, 1))
```
Out[23]:
```
0
```
In [24]:
```
integrate(sin(x), (x, 0, pi/2))
```
Out[24]:
```
1
```
In [25]:
```
integrate(cos(x), (x, -pi/2, pi/2))
```
Out[25]:
```
2
```
不标准积分也支持:
In [26]:
```
integrate(exp(-x), (x, 0, oo))
```
Out[26]:
```
1
```
In [27]:
```
integrate(exp(-x**2), (x, -oo, oo))
```
Out[27]:
```
sqrt(pi)
```
#### 3.2.3.5 练习
### 3.2.4 方程求解
SymPy可以求解线性代数方程,一个或多个变量:
In [28]:
```
solve(x**4 - 1, x)
```
Out[28]:
```
[-1, 1, -I, I]
```
如你所见,第一个参数是假设等于0的表达式。它可以解一个很大的多项式方程,也可以有能力求解多个方程,可以将各自的多个变量作为元组以第二个参数给出:
In [29]:
```
solve([x + 5*y - 2, -3*x + 6*y - 15], [x, y])
```
Out[29]:
```
{x: -3, y: 1}
```
也直接求解超越方程(有限的):
In [30]:
```
solve(exp(x) + 1, x)
```
Out[30]:
```
[I*pi]
```
多项式方程的另一个应用是`factor`。`factor`将多项式因式分解为可化简的项,并且可以计算不同域的因式:
In [31]:
```
f = x**4 - 3*x**2 + 1
factor(f)
```
Out[31]:
```
(x**2 - x - 1)*(x**2 + x - 1)
```
In [32]:
```
factor(f, modulus=5)
```
Out[32]:
```
(x - 2)**2*(x + 2)**2
```
SymPy也可以解布尔方程,即,判断一个布尔表达式是否满足。对于这个情况,我们可以使用`satisfiable`函数:
In [33]:
```
satisfiable(x & y)
```
Out[33]:
```
{x: True, y: True}
```
这告诉我们`(x & y)`是真,当x和y都是True的时候。如果一个表达式不是True,即它的任何参数值都无法使表达式为真,那么它将返回False:
In [34]:
```
satisfiable(x & ~x)
```
Out[34]:
```
False
```
### 3.2.4.1 练习
* 求解系统方程$x + y = 2$, $2\cdot x + y = 0$
* 是否存在布尔值,使$(~x | y) & (~y | x)$为真?
### 3.2.5 线性代数
#### 3.2.5.1 矩阵
矩阵通过Matrix类的一个实例来创建:
In [35]:
```
from sympy import Matrix
Matrix([[1,0], [0,1]])
```
Out[35]:
```
Matrix([
[1, 0],
[0, 1]])
```
与NumPy数组不同,你也可以在里面放入符号:
In [36]:
```
x = Symbol('x')
y = Symbol('y')
A = Matrix([[1,x], [y,1]])
A
```
Out[36]:
```
Matrix([
[1, x],
[y, 1]])
```
In [37]:
```
A**2
```
Out[37]:
```
Matrix([
[x*y + 1, 2*x],
[ 2*y, x*y + 1]])
```
### 3.2.5.2 微分方程
SymPy可以解 (一些) 常规微分。要求解一个微分方程,使用`dsolve`。首先,通过传递cls=Function来创建一个未定义的符号函数:
In [38]:
```
f, g = symbols('f g', cls=Function)
```
f 和 g是未定义函数。我们可以调用f(x), 并且它可以代表未知的函数:
In [39]:
```
f(x)
```
Out[39]:
```
f(x)
```
In [40]:
```
f(x).diff(x, x) + f(x)
```
Out[40]:
```
f(x) + Derivative(f(x), x, x)
```
In [41]:
```
dsolve(f(x).diff(x, x) + f(x), f(x))
```
Out[41]:
```
f(x) == C1*sin(x) + C2*cos(x)
```
关键词参数可以向这个函数传递,以便帮助确认是否找到最适合的解决系统。例如,你知道它是独立的方程,你可以使用关键词hint=’separable’来强制`dsolve`来将它作为独立方程来求解:
In [42]:
```
dsolve(sin(x)*cos(f(x)) + cos(x)*sin(f(x))*f(x).diff(x), f(x), hint='separable')
```
Out[42]:
```
[f(x) == -asin(sqrt(C1/cos(x)**2 + 1)) + pi,
f(x) == asin(sqrt(C1/cos(x)**2 + 1)) + pi,
f(x) == -asin(sqrt(C1/cos(x)**2 + 1)),
f(x) == asin(sqrt(C1/cos(x)**2 + 1))]
```
**练习**
* 求解Bernoulli微分方程
$x \frac{d f(x)}{x} + f(x) - f(x)^2=0$
* 使用hint=’Bernoulli’求解相同的公式。可以观察到什么?
3.1 Python中的统计学
最后更新于:2022-04-01 11:21:56
# 3.1 Python中的统计学
In [1]:
```
%matplotlib inline
import numpy as np
```
> **作者** : Gaël Varoquaux
**必要条件**
* 标准Python科学计算环境 (numpy, scipy, matplotlib)
* [Pandas](http://pandas.pydata.org/)
* [Statsmodels](http://statsmodels.sourceforge.net/)
* [Seaborn](http://stanford.edu/~mwaskom/software/seaborn/)
要安装Python及这些依赖,推荐下载[Anaconda Python](http://continuum.io/downloads) 或 [Enthought Canopy](https://store.enthought.com/), 如果你使用Ubuntu或其他linux更应该使用包管理器。
**也可以看一下: Python中的贝叶斯统计**
本章并不会涉及贝叶斯统计工具。适用于贝叶斯模型的是[PyMC](http://pymc-devs.github.io/pymc), 在Python中实现了概率编程语言。
**为什么统计学要用Python?**
R是一门专注于统计学的语言。Python是带有统计学模块的通用编程语言。R比Python有更多的统计分析功能,以及专用的语法。但是,当面对构建复杂的分析管道,混合统计学以及例如图像分析、文本挖掘或者物理实验控制,Python的富有就是物价的优势。
**内容**
* 数据表征和交互
* 数据作为表格
* panda data-frame
* 假设检验: 对比两个组
* Student’s t-test: 最简单的统计检验
* 配对实验: 对同一个体的重复测量
* 线性模型、多因素和方差分析
* 用“公式” 来在Python中指定统计模型
* 多元回归: 包含多元素
* 事后假设检验: 方差分析 (ANOVA)
* 更多的可视化: 用seaborn来进行统计学探索
* 配对图: 散点矩阵
* lmplot: 绘制一个单变量回归
* 交互作用检验
**免责声明: 性别问题**
本教程中的一些实例选自性别问题。其原因是在这种问题上这种控制的声明实际上影响了很多人。
## 3.1.1 数据表征和交互
### 3.1.1.1 数据作为表格
统计分析中我们关注的设定是通过一组不同的属性或特征来描述多个观察或样本。然后这个数据可以被视为2D表格,或矩阵,列是数据的不同属性,行是观察。例如包含在[examples/brain_size.csv](http://www.scipy-lectures.org/_downloads/brain_size.csv)的数据:
`"";"Gender";"FSIQ";"VIQ";"PIQ";"Weight";"Height";"MRI_Count" "1";"Female";133;132;124;"118";"64.5";816932 "2";"Male";140;150;124;".";"72.5";1001121 "3";"Male";139;123;150;"143";"73.3";1038437 "4";"Male";133;129;128;"172";"68.8";965353 "5";"Female";137;132;134;"147";"65.0";951545`
### 3.1.1.2 panda data-frame
我们将会在来自[pandas](http://pandas.pydata.org/)模块的[pandas.DataFrame](http://pandas.pydata.org/pandas-docs/stable/generated/pandas.DataFrame.html#pandas.DataFrame)中存储和操作这个数据。它是电子表格程序在Python中的一个等价物。它与2D `numpy`数据的区别在于列带有名字,可以在列中存储混合的数据类型,并且有精妙的选择和透视表机制。
#### 3.1.1.2.1 创建dataframes: 读取数据文件或转化数组
**从CSV文件读取**: 使用上面的CSV文件,给出了大脑大小重量和IQ (Willerman et al. 1991) 的观察值 , 数据混合了数量值和类型值:
In [3]:
```
import pandas
data = pandas.read_csv('examples/brain_size.csv', sep=';', na_values=".")
data
```
Out[3]:
| | Unnamed: 0 | Gender | FSIQ | VIQ | PIQ | Weight | Height | MRI_Count |
| --- | --- | --- | --- | --- | --- | --- | --- | --- |
| 0 | 1 | Female | 133 | 132 | 124 | 118 | 64.5 | 816932 |
| 1 | 2 | Male | 140 | 150 | 124 | NaN | 72.5 | 1001121 |
| 2 | 3 | Male | 139 | 123 | 150 | 143 | 73.3 | 1038437 |
| 3 | 4 | Male | 133 | 129 | 128 | 172 | 68.8 | 965353 |
| 4 | 5 | Female | 137 | 132 | 134 | 147 | 65.0 | 951545 |
| 5 | 6 | Female | 99 | 90 | 110 | 146 | 69.0 | 928799 |
| 6 | 7 | Female | 138 | 136 | 131 | 138 | 64.5 | 991305 |
| 7 | 8 | Female | 92 | 90 | 98 | 175 | 66.0 | 854258 |
| 8 | 9 | Male | 89 | 93 | 84 | 134 | 66.3 | 904858 |
| 9 | 10 | Male | 133 | 114 | 147 | 172 | 68.8 | 955466 |
| 10 | 11 | Female | 132 | 129 | 124 | 118 | 64.5 | 833868 |
| 11 | 12 | Male | 141 | 150 | 128 | 151 | 70.0 | 1079549 |
| 12 | 13 | Male | 135 | 129 | 124 | 155 | 69.0 | 924059 |
| 13 | 14 | Female | 140 | 120 | 147 | 155 | 70.5 | 856472 |
| 14 | 15 | Female | 96 | 100 | 90 | 146 | 66.0 | 878897 |
| 15 | 16 | Female | 83 | 71 | 96 | 135 | 68.0 | 865363 |
| 16 | 17 | Female | 132 | 132 | 120 | 127 | 68.5 | 852244 |
| 17 | 18 | Male | 100 | 96 | 102 | 178 | 73.5 | 945088 |
| 18 | 19 | Female | 101 | 112 | 84 | 136 | 66.3 | 808020 |
| 19 | 20 | Male | 80 | 77 | 86 | 180 | 70.0 | 889083 |
| 20 | 21 | Male | 83 | 83 | 86 | NaN | NaN | 892420 |
| 21 | 22 | Male | 97 | 107 | 84 | 186 | 76.5 | 905940 |
| 22 | 23 | Female | 135 | 129 | 134 | 122 | 62.0 | 790619 |
| 23 | 24 | Male | 139 | 145 | 128 | 132 | 68.0 | 955003 |
| 24 | 25 | Female | 91 | 86 | 102 | 114 | 63.0 | 831772 |
| 25 | 26 | Male | 141 | 145 | 131 | 171 | 72.0 | 935494 |
| 26 | 27 | Female | 85 | 90 | 84 | 140 | 68.0 | 798612 |
| 27 | 28 | Male | 103 | 96 | 110 | 187 | 77.0 | 1062462 |
| 28 | 29 | Female | 77 | 83 | 72 | 106 | 63.0 | 793549 |
| 29 | 30 | Female | 130 | 126 | 124 | 159 | 66.5 | 866662 |
| 30 | 31 | Female | 133 | 126 | 132 | 127 | 62.5 | 857782 |
| 31 | 32 | Male | 144 | 145 | 137 | 191 | 67.0 | 949589 |
| 32 | 33 | Male | 103 | 96 | 110 | 192 | 75.5 | 997925 |
| 33 | 34 | Male | 90 | 96 | 86 | 181 | 69.0 | 879987 |
| 34 | 35 | Female | 83 | 90 | 81 | 143 | 66.5 | 834344 |
| 35 | 36 | Female | 133 | 129 | 128 | 153 | 66.5 | 948066 |
| 36 | 37 | Male | 140 | 150 | 124 | 144 | 70.5 | 949395 |
| 37 | 38 | Female | 88 | 86 | 94 | 139 | 64.5 | 893983 |
| 38 | 39 | Male | 81 | 90 | 74 | 148 | 74.0 | 930016 |
| 39 | 40 | Male | 89 | 91 | 89 | 179 | 75.5 | 935863 |
> **分割符** 它是CSV文件,但是分割符是”;”
>
> **缺失值** CSV中的第二个个体的weight是缺失的。如果我们没有指定缺失值 (NA = not available) 标记符, 我们将无法进行统计分析。
**从数组中创建**: [pandas.DataFrame](http://pandas.pydata.org/pandas-docs/stable/generated/pandas.DataFrame.html#pandas.DataFrame) 也可以视为1D序列, 例如数组或列表的字典,如果我们有3个`numpy`数组:
In [4]:
```
import numpy as np
t = np.linspace(-6, 6, 20)
sin_t = np.sin(t)
cos_t = np.cos(t)
```
我们可以将他们暴露为[pandas.DataFrame](http://pandas.pydata.org/pandas-docs/stable/generated/pandas.DataFrame.html#pandas.DataFrame):
In [5]:
```
pandas.DataFrame({'t': t, 'sin': sin_t, 'cos': cos_t})
```
Out[5]:
| | cos | sin | t |
| --- | --- | --- | --- |
| 0 | 0.960170 | 0.279415 | -6.000000 |
| 1 | 0.609977 | 0.792419 | -5.368421 |
| 2 | 0.024451 | 0.999701 | -4.736842 |
| 3 | -0.570509 | 0.821291 | -4.105263 |
| 4 | -0.945363 | 0.326021 | -3.473684 |
| 5 | -0.955488 | -0.295030 | -2.842105 |
| 6 | -0.596979 | -0.802257 | -2.210526 |
| 7 | -0.008151 | -0.999967 | -1.578947 |
| 8 | 0.583822 | -0.811882 | -0.947368 |
| 9 | 0.950551 | -0.310567 | -0.315789 |
| 10 | 0.950551 | 0.310567 | 0.315789 |
| 11 | 0.583822 | 0.811882 | 0.947368 |
| 12 | -0.008151 | 0.999967 | 1.578947 |
| 13 | -0.596979 | 0.802257 | 2.210526 |
| 14 | -0.955488 | 0.295030 | 2.842105 |
| 15 | -0.945363 | -0.326021 | 3.473684 |
| 16 | -0.570509 | -0.821291 | 4.105263 |
| 17 | 0.024451 | -0.999701 | 4.736842 |
| 18 | 0.609977 | -0.792419 | 5.368421 |
| 19 | 0.960170 | -0.279415 | 6.000000 |
**其他输入**: [pandas](http://pandas.pydata.org/) 可以从SQL、excel文件或者其他格式输入数。见[pandas文档](http://pandas.pydata.org/)。
#### 3.1.1.2.2 操作数据
`data`是[pandas.DataFrame](http://pandas.pydata.org/pandas-docs/stable/generated/pandas.DataFrame.html#pandas.DataFrame), 与R的dataframe类似:
In [6]:
```
data.shape # 40行8列
```
Out[6]:
```
(40, 8)
```
In [7]:
```
data.columns # 有列
```
Out[7]:
```
Index([u'Unnamed: 0', u'Gender', u'FSIQ', u'VIQ', u'PIQ', u'Weight', u'Height',
u'MRI_Count'],
dtype='object')
```
In [8]:
```
print(data['Gender']) # 列可以用名字访问
```
```
0 Female
1 Male
2 Male
3 Male
4 Female
5 Female
6 Female
7 Female
8 Male
9 Male
10 Female
11 Male
12 Male
13 Female
14 Female
15 Female
16 Female
17 Male
18 Female
19 Male
20 Male
21 Male
22 Female
23 Male
24 Female
25 Male
26 Female
27 Male
28 Female
29 Female
30 Female
31 Male
32 Male
33 Male
34 Female
35 Female
36 Male
37 Female
38 Male
39 Male
Name: Gender, dtype: object
```
In [9]:
```
# 简单选择器
data[data['Gender'] == 'Female']['VIQ'].mean()
```
Out[9]:
```
109.45
```
> **注意**: 对于一个大dataframe的快速预览,用它的`describe`方法: [pandas.DataFrame.describe()](http://pandas.pydata.org/pandas-docs/stable/generated/pandas.DataFrame.describe.html#pandas.DataFrame.describe)。
**groupby**: 根据类别变量的值拆分dataframe:
In [10]:
```
groupby_gender = data.groupby('Gender')
for gender, value in groupby_gender['VIQ']:
print((gender, value.mean()))
```
```
('Female', 109.45)
('Male', 115.25)
```
**groupby_gender**是一个强力的对象,暴露了结果dataframes组的许多操作:
In [11]:
```
groupby_gender.mean()
```
Out[11]:
| | Unnamed: 0 | FSIQ | VIQ | PIQ | Weight | Height | MRI_Count |
| --- | --- | --- | --- | --- | --- | --- | --- |
| Gender |
| Female | 19.65 | 111.9 | 109.45 | 110.45 | 137.200000 | 65.765000 | 862654.6 |
| Male | 21.35 | 115.0 | 115.25 | 111.60 | 166.444444 | 71.431579 | 954855.4 |
在`groupby_gender`上使用tab-完成来查找更多。其他的常见分组函数是median, count (对于检查不同子集的缺失值数量很有用) 或sum。Groupby评估是懒惰模式,因为在应用聚合函数之前不会进行什么工作。
> **练习**
>
> * 完整人口VIO的平均值是多少?
> * 这项研究中包含了多少男性 / 女性?
> * **提示** 使用‘tab完成’来寻找可以调用的方法, 替换在上面例子中的‘mean’。
> * 对于男性和女性来说,以log为单位显示的MRI count平均值是多少?

> **注意**: 上面的绘图中使用了`groupby_gender.boxplot` (见[这个例子](http://www.scipy-lectures.org/packages/statistics/auto_examples/plot_pandas.html#example-plot-pandas-py))。
#### 3.1.1.2.3 绘制数据
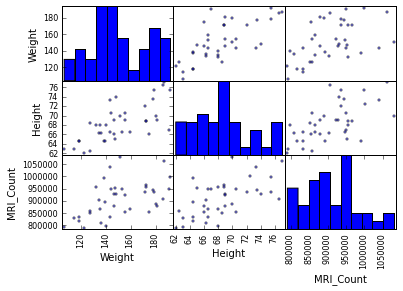
Pandas提供一些绘图工具 (`pandas.tools.plotting`, 后面使用的是matplotlib) 来显示在dataframes数据的统计值:
**散点图矩阵**:
In [15]:
```
from pandas.tools import plotting
plotting.scatter_matrix(data[['Weight', 'Height', 'MRI_Count']])
```
Out[15]:
```
array([[<matplotlib.axes._subplots.AxesSubplot object at 0x105c34810>,
<matplotlib.axes._subplots.AxesSubplot object at 0x10a0ade10>,
<matplotlib.axes._subplots.AxesSubplot object at 0x10a2d80d0>],
[<matplotlib.axes._subplots.AxesSubplot object at 0x10a33b210>,
<matplotlib.axes._subplots.AxesSubplot object at 0x10a3be450>,
<matplotlib.axes._subplots.AxesSubplot object at 0x10a40d9d0>],
[<matplotlib.axes._subplots.AxesSubplot object at 0x10a49dc10>,
<matplotlib.axes._subplots.AxesSubplot object at 0x10a51f850>,
<matplotlib.axes._subplots.AxesSubplot object at 0x10a5902d0>]], dtype=object)
```
```
/Library/Frameworks/Python.framework/Versions/2.7/lib/python2.7/site-packages/matplotlib/collections.py:590: FutureWarning: elementwise comparison failed; returning scalar instead, but in the future will perform elementwise comparison
if self._edgecolors == str('face'):
```
In [16]:
```
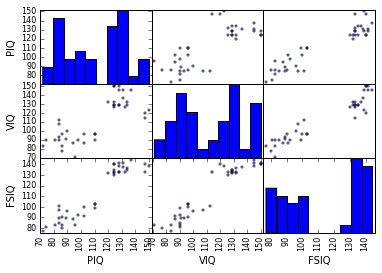
plotting.scatter_matrix(data[['PIQ', 'VIQ', 'FSIQ']])
```
Out[16]:
```
array([[<matplotlib.axes._subplots.AxesSubplot object at 0x10a918b50>,
<matplotlib.axes._subplots.AxesSubplot object at 0x10aa38710>,
<matplotlib.axes._subplots.AxesSubplot object at 0x10ab29910>],
[<matplotlib.axes._subplots.AxesSubplot object at 0x10ab8e790>,
<matplotlib.axes._subplots.AxesSubplot object at 0x10ae207d0>,
<matplotlib.axes._subplots.AxesSubplot object at 0x10abbd090>],
[<matplotlib.axes._subplots.AxesSubplot object at 0x10af140d0>,
<matplotlib.axes._subplots.AxesSubplot object at 0x10af89cd0>,
<matplotlib.axes._subplots.AxesSubplot object at 0x10affa410>]], dtype=object)
```
> **两个总体**
>
> IQ指标是双峰的, 似乎有两个子总体。
>
> **练习**
>
> 只绘制男性的散点图矩阵,然后是只有女性的。你是否认为2个子总体与性别相关?
## 3.1.2 假设检验: 比较两个组
对于简单的[统计检验](https://en.wikipedia.org/wiki/Statistical_hypothesis_testing),我们将可以使用[scipy](http://docs.scipy.org/doc/)的子摸块[scipy.stats](http://docs.scipy.org/doc/scipy/reference/stats.html#module-scipy.stats):
In [17]:
```
from scipy import stats
```
> **也看一下**: Scipy是一个很大的库。关于整个库的快速预览,可以看一下[scipy](http://nbviewer.ipython.org/github/cloga/scipy-lecture-notes_cn/blob/master/1.5.%20Scipy%EF%BC%9A%E9%AB%98%E7%BA%A7%E7%A7%91%E5%AD%A6%E8%AE%A1%E7%AE%97.ipynb) 章节。
### 3.1.2.1 Student’s t检验: 最简单的统计检验
#### 3.1.2.1.1 单样本 t-检验: 检验总体平均数的值
[scipy.stats.ttest_1samp()](http://docs.scipy.org/doc/scipy/reference/generated/scipy.stats.ttest_1samp.html#scipy.stats.ttest_1samp)检验数据总体的平均数是否可能等于给定值 (严格来说是否观察值来自于给定总体平均数的正态分布)。它返回一个[T统计值](https://en.wikipedia.org/wiki/Student%27s_t-test)以及[p-值](https://en.wikipedia.org/wiki/P-value) (见函数的帮助):
In [18]:
```
stats.ttest_1samp(data['VIQ'], 0)
```
Out[18]:
```
(30.088099970849328, 1.3289196468728067e-28)
```
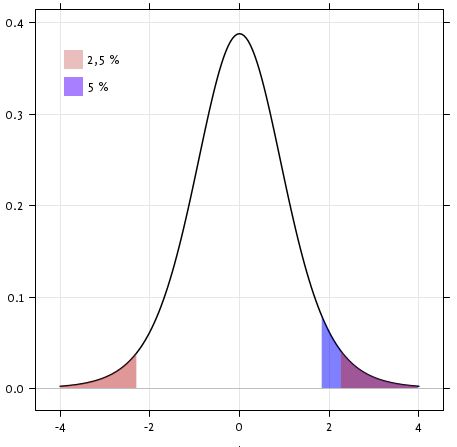
根据$10^-28$的p-值,我们可以声称IQ(VIQ的测量值)总体平均数不是0。
#### 3.1.2.1.2 双样本 t-检验: 检验不同总体的差异
我们已经看到男性和女性总体VIQ平均数是不同的。要检验这个差异是否是显著的,我们可以用[scipy.stats.ttest_ind()](http://docs.scipy.org/doc/scipy/reference/generated/scipy.stats.ttest_ind.html#scipy.stats.ttest_ind)进行双样本检验:
In [19]:
```
female_viq = data[data['Gender'] == 'Female']['VIQ']
male_viq = data[data['Gender'] == 'Male']['VIQ']
stats.ttest_ind(female_viq, male_viq)
```
Out[19]:
```
(-0.77261617232750113, 0.44452876778583217)
```
### 3.1.2.2 配对实验: 同一个体的重复测量
PIQ、VIQ和FSIQ给出了IQ的3种测量值。让我检验一下FISQ和PIQ是否有显著差异。我们可以使用双样本检验:
In [20]:
```
stats.ttest_ind(data['FSIQ'], data['PIQ'])
```
Out[20]:
```
(0.46563759638096403, 0.64277250094148408)
```
使用这种方法的问题是忘记了两个观察之间有联系: FSIQ 和 PIQ 是在相同的个体上进行的测量。因此被试之间的差异是混淆的,并且可以使用"配对实验"或"[重复测量实验](https://en.wikipedia.org/wiki/Repeated_measures_design)"来消除。
In [21]:
```
stats.ttest_rel(data['FSIQ'], data['PIQ'])
```
Out[21]:
```
(1.7842019405859857, 0.082172638183642358)
```

这等价于单样本的差异检验:
In [22]:
```
stats.ttest_1samp(data['FSIQ'] - data['PIQ'], 0)
```
Out[22]:
```
(1.7842019405859857, 0.082172638183642358)
```

T-tests假定高斯误差。我们可以使用[威尔科克森符号秩检验](https://en.wikipedia.org/wiki/Wilcoxon_signed-rank_test), 放松了这个假设:
In [23]:
```
stats.wilcoxon(data['FSIQ'], data['PIQ'])
```
Out[23]:
```
(274.5, 0.10659492713506856)
```
> **注意:** 非配对实验对应的非参数检验是[曼惠特尼U检验](https://en.wikipedia.org/wiki/Mann%E2%80%93Whitney_U), [scipy.stats.mannwhitneyu()](http://docs.scipy.org/doc/scipy/reference/generated/scipy.stats.mannwhitneyu.html#scipy.stats.mannwhitneyu)。
>
> **练习**
>
> * 检验男性和女性重量的差异。
> * 使用非参数检验来检验男性和女性VIQ的差异。
>
> **结论**: 我们发现数据并不支持男性和女性VIQ不同的假设。
## 3.1.3 线性模型、多因素和因素分析
### 3.1.3.1 用“公式” 来在Python中指定统计模型
#### 3.1.3.1.1 简单线性回归
给定两组观察值,x和y, 我们想要检验假设y是x的线性函数,换句话说:
$y = x * coef + intercept + e$
其中$e$是观察噪音。我们将使用[statmodels module](http://statsmodels.sourceforge.net/):
* 拟合一个线性模型。我们将使用简单的策略,[普通最小二乘](https://en.wikipedia.org/wiki/Ordinary_least_squares) (OLS)。
* 检验系数是否是非0。

首先,我们生成模型的虚拟数据:
In [9]:
```
import numpy as np
x = np.linspace(-5, 5, 20)
np.random.seed(1)
# normal distributed noise
y = -5 + 3*x + 4 * np.random.normal(size=x.shape)
# Create a data frame containing all the relevant variables
data = pandas.DataFrame({'x': x, 'y': y})
```
> **Python中的统计公式**
>
> [见statsmodels文档](http://statsmodels.sourceforge.net/stable/example_formulas.html)
然后我们指定一个OLS模型并且拟合它:
In [10]:
```
from statsmodels.formula.api import ols
model = ols("y ~ x", data).fit()
```
我们可以检查fit产生的各种统计量:
In [26]:
```
print(model.summary())
```
```
OLS Regression Results
==============================================================================
Dep. Variable: y R-squared: 0.804
Model: OLS Adj. R-squared: 0.794
Method: Least Squares F-statistic: 74.03
Date: Wed, 18 Nov 2015 Prob (F-statistic): 8.56e-08
Time: 17:10:03 Log-Likelihood: -57.988
No. Observations: 20 AIC: 120.0
Df Residuals: 18 BIC: 122.0
Df Model: 1
Covariance Type: nonrobust
==============================================================================
coef std err t P>|t| [95.0% Conf. Int.]
------------------------------------------------------------------------------
Intercept -5.5335 1.036 -5.342 0.000 -7.710 -3.357
x 2.9369 0.341 8.604 0.000 2.220 3.654
==============================================================================
Omnibus: 0.100 Durbin-Watson: 2.956
Prob(Omnibus): 0.951 Jarque-Bera (JB): 0.322
Skew: -0.058 Prob(JB): 0.851
Kurtosis: 2.390 Cond. No. 3.03
==============================================================================
Warnings:
[1] Standard Errors assume that the covariance matrix of the errors is correctly specified.
```
> **术语**:
>
> Statsmodels使用统计术语: statsmodel的y变量被称为‘endogenous’而x变量被称为exogenous。更详细的讨论见[这里](http://statsmodels.sourceforge.net/devel/endog_exog.html)。
>
> 为了简化,y (endogenous) 是你要尝试预测的值,而 x (exogenous) 代表用来进行这个预测的特征。
>
> **练习**
>
> 从以上模型中取回估计参数。**提示**: 使用tab-完成来找到相关的属性。
#### 3.1.3.1.2 类别变量: 比较组或多个类别
让我们回到大脑大小的数据:
In [27]:
```
data = pandas.read_csv('examples/brain_size.csv', sep=';', na_values=".")
```
我们可以写一个比较,用线性模型比较男女IQ:
In [28]:
```
model = ols("VIQ ~ Gender + 1", data).fit()
print(model.summary())
```
```
OLS Regression Results
==============================================================================
Dep. Variable: VIQ R-squared: 0.015
Model: OLS Adj. R-squared: -0.010
Method: Least Squares F-statistic: 0.5969
Date: Wed, 18 Nov 2015 Prob (F-statistic): 0.445
Time: 17:34:10 Log-Likelihood: -182.42
No. Observations: 40 AIC: 368.8
Df Residuals: 38 BIC: 372.2
Df Model: 1
Covariance Type: nonrobust
==================================================================================
coef std err t P>|t| [95.0% Conf. Int.]
----------------------------------------------------------------------------------
Intercept 109.4500 5.308 20.619 0.000 98.704 120.196
Gender[T.Male] 5.8000 7.507 0.773 0.445 -9.397 20.997
==============================================================================
Omnibus: 26.188 Durbin-Watson: 1.709
Prob(Omnibus): 0.000 Jarque-Bera (JB): 3.703
Skew: 0.010 Prob(JB): 0.157
Kurtosis: 1.510 Cond. No. 2.62
==============================================================================
Warnings:
[1] Standard Errors assume that the covariance matrix of the errors is correctly specified.
```
**特定模型的提示**
**强制类别**: ‘Gender’ 被自动识别为类别变量,因此,它的每一个不同值都被处理为不同的实体。 使用:
In [29]:
```
model = ols('VIQ ~ C(Gender)', data).fit()
```
可以将一个整数列强制作为类别处理。
**截距**: 我们可以在公式中用-1删除截距,或者用+1强制使用截距。
默认,statsmodel将带有K和可能值的类别变量处理为K-1'虚拟变量' (最后一个水平被吸收到截距项中)。在绝大多数情况下,这都是很好的默认选择 - 但是,为类别变量指定不同的编码方式也是可以的 ([http://statsmodels.sourceforge.net/devel/contrasts.html)。](http://statsmodels.sourceforge.net/devel/contrasts.html)。)
**FSIQ和PIQ差异的t-检验**
要比较不同类型的IQ,我们需要创建一个"长形式"的表格,用一个类别变量来标识IQ类型:
In [30]:
```
data_fisq = pandas.DataFrame({'iq': data['FSIQ'], 'type': 'fsiq'})
data_piq = pandas.DataFrame({'iq': data['PIQ'], 'type': 'piq'})
data_long = pandas.concat((data_fisq, data_piq))
print(data_long)
```
```
iq type
0 133 fsiq
1 140 fsiq
2 139 fsiq
3 133 fsiq
4 137 fsiq
5 99 fsiq
6 138 fsiq
7 92 fsiq
8 89 fsiq
9 133 fsiq
10 132 fsiq
11 141 fsiq
12 135 fsiq
13 140 fsiq
14 96 fsiq
15 83 fsiq
16 132 fsiq
17 100 fsiq
18 101 fsiq
19 80 fsiq
20 83 fsiq
21 97 fsiq
22 135 fsiq
23 139 fsiq
24 91 fsiq
25 141 fsiq
26 85 fsiq
27 103 fsiq
28 77 fsiq
29 130 fsiq
.. ... ...
10 124 piq
11 128 piq
12 124 piq
13 147 piq
14 90 piq
15 96 piq
16 120 piq
17 102 piq
18 84 piq
19 86 piq
20 86 piq
21 84 piq
22 134 piq
23 128 piq
24 102 piq
25 131 piq
26 84 piq
27 110 piq
28 72 piq
29 124 piq
30 132 piq
31 137 piq
32 110 piq
33 86 piq
34 81 piq
35 128 piq
36 124 piq
37 94 piq
38 74 piq
39 89 piq
[80 rows x 2 columns]
```
In [31]:
```
model = ols("iq ~ type", data_long).fit()
print(model.summary())
```
```
OLS Regression Results
==============================================================================
Dep. Variable: iq R-squared: 0.003
Model: OLS Adj. R-squared: -0.010
Method: Least Squares F-statistic: 0.2168
Date: Wed, 18 Nov 2015 Prob (F-statistic): 0.643
Time: 18:16:40 Log-Likelihood: -364.35
No. Observations: 80 AIC: 732.7
Df Residuals: 78 BIC: 737.5
Df Model: 1
Covariance Type: nonrobust
===============================================================================
coef std err t P>|t| [95.0% Conf. Int.]
-------------------------------------------------------------------------------
Intercept 113.4500 3.683 30.807 0.000 106.119 120.781
type[T.piq] -2.4250 5.208 -0.466 0.643 -12.793 7.943
==============================================================================
Omnibus: 164.598 Durbin-Watson: 1.531
Prob(Omnibus): 0.000 Jarque-Bera (JB): 8.062
Skew: -0.110 Prob(JB): 0.0178
Kurtosis: 1.461 Cond. No. 2.62
==============================================================================
Warnings:
[1] Standard Errors assume that the covariance matrix of the errors is correctly specified.
```
我们可以看到我们获得了与前面t-检验相同的值,以及相同的对应iq type的p-值:
In [32]:
```
stats.ttest_ind(data['FSIQ'], data['PIQ'])
```
Out[32]:
```
(0.46563759638096403, 0.64277250094148408)
```
### 3.1.3.2 多元回归: 包含多因素
考虑用2个变量x和y来解释变量z的线性模型:
$z = x \, c_1 + y \, c_2 + i + e$
这个模型可以被视为在3D世界中用一个平面去拟合 (x, y, z) 的点云。

**实例: 鸢尾花数据 ([examples/iris.csv](examples/iris.csv))**
萼片和花瓣的大小似乎是相关的: 越大的花越大! 但是,在不同的种之间是否有额外的系统效应?

In [33]:
```
data = pandas.read_csv('examples/iris.csv')
model = ols('sepal_width ~ name + petal_length', data).fit()
print(model.summary())
```
```
OLS Regression Results
==============================================================================
Dep. Variable: sepal_width R-squared: 0.478
Model: OLS Adj. R-squared: 0.468
Method: Least Squares F-statistic: 44.63
Date: Thu, 19 Nov 2015 Prob (F-statistic): 1.58e-20
Time: 09:56:04 Log-Likelihood: -38.185
No. Observations: 150 AIC: 84.37
Df Residuals: 146 BIC: 96.41
Df Model: 3
Covariance Type: nonrobust
======================================================================================
coef std err t P>|t| [95.0% Conf. Int.]
--------------------------------------------------------------------------------------
Intercept 2.9813 0.099 29.989 0.000 2.785 3.178
name[T.versicolor] -1.4821 0.181 -8.190 0.000 -1.840 -1.124
name[T.virginica] -1.6635 0.256 -6.502 0.000 -2.169 -1.158
petal_length 0.2983 0.061 4.920 0.000 0.178 0.418
==============================================================================
Omnibus: 2.868 Durbin-Watson: 1.753
Prob(Omnibus): 0.238 Jarque-Bera (JB): 2.885
Skew: -0.082 Prob(JB): 0.236
Kurtosis: 3.659 Cond. No. 54.0
==============================================================================
Warnings:
[1] Standard Errors assume that the covariance matrix of the errors is correctly specified.
```
### 3.1.3.3 事后假设检验: 方差分析 (ANOVA))
在上面的鸢尾花例子中,在排除了萼片的影响之后,我们想要检验versicolor和virginica的花瓣长度是否有差异。这可以被公式化为检验在上面的线性模型中versicolor和virginica系数的差异 (方差分析, ANOVA)。我们写了"差异"向量的参数来估计: 我们想要用[F-检验](https://en.wikipedia.org/wiki/F-test)检验 "`name[T.versicolor] - name[T.virginica]`":
In [36]:
```
print(model.f_test([0, 1, -1, 0]))
```
```
<F test: F=array([[ 3.24533535]]), p=0.073690587817, df_denom=146, df_num=1>
```
是否差异显著?
> **练习** 回到大脑大小 + IQ 数据, 排除了大脑大小、高度和重量的影响后,检验男女的VIQ差异。
## 3.1.4 更多可视化: 用seaborn来进行统计学探索
[Seaborn](http://stanford.edu/~mwaskom/software/seaborn/) 集成了简单的统计学拟合与pandas dataframes绘图。
让我们考虑一个500个个体的工资及其它个人信息的数据 ([Berndt, ER. The Practice of Econometrics. 1991\. NY: Addison-Wesley](http://lib.stat.cmu.edu/datasets/CPS_85_Wages))。
加载并绘制工资数据的完整代码可以在[对应的例子](http://www.scipy-lectures.org/packages/statistics/auto_examples/plot_wage_data.html#example-plot-wage-data-py)中找到。
In [3]:
```
print data
```
```
EDUCATION SOUTH SEX EXPERIENCE UNION WAGE AGE RACE OCCUPATION \
0 8 0 1 21 0 5.10 35 2 6
1 9 0 1 42 0 4.95 57 3 6
2 12 0 0 1 0 6.67 19 3 6
3 12 0 0 4 0 4.00 22 3 6
4 12 0 0 17 0 7.50 35 3 6
5 13 0 0 9 1 13.07 28 3 6
6 10 1 0 27 0 4.45 43 3 6
7 12 0 0 9 0 19.47 27 3 6
8 16 0 0 11 0 13.28 33 3 6
9 12 0 0 9 0 8.75 27 3 6
10 12 0 0 17 1 11.35 35 3 6
11 12 0 0 19 1 11.50 37 3 6
12 8 1 0 27 0 6.50 41 3 6
13 9 1 0 30 1 6.25 45 3 6
14 9 1 0 29 0 19.98 44 3 6
15 12 0 0 37 0 7.30 55 3 6
16 7 1 0 44 0 8.00 57 3 6
17 12 0 0 26 1 22.20 44 3 6
18 11 0 0 16 0 3.65 33 3 6
19 12 0 0 33 0 20.55 51 3 6
20 12 0 1 16 1 5.71 34 3 6
21 7 0 0 42 1 7.00 55 1 6
22 12 0 0 9 0 3.75 27 3 6
23 11 1 0 14 0 4.50 31 1 6
24 12 0 0 23 0 9.56 41 3 6
25 6 1 0 45 0 5.75 57 3 6
26 12 0 0 8 0 9.36 26 3 6
27 10 0 0 30 0 6.50 46 3 6
28 12 0 1 8 0 3.35 26 3 6
29 12 0 0 8 0 4.75 26 3 6
.. ... ... ... ... ... ... ... ... ...
504 17 0 1 10 0 11.25 33 3 5
505 16 0 1 10 1 6.67 32 3 5
506 16 0 1 17 0 8.00 39 2 5
507 18 0 0 7 0 18.16 31 3 5
508 16 0 1 14 0 12.00 36 3 5
509 16 0 1 22 1 8.89 44 3 5
510 17 0 1 14 0 9.50 37 3 5
511 16 0 0 11 0 13.65 33 3 5
512 18 0 0 23 1 12.00 47 3 5
513 12 0 0 39 1 15.00 57 3 5
514 16 0 0 15 0 12.67 37 3 5
515 14 0 1 15 0 7.38 35 2 5
516 16 0 0 10 0 15.56 32 3 5
517 12 1 1 25 0 7.45 43 3 5
518 14 0 1 12 0 6.25 32 3 5
519 16 1 1 7 0 6.25 29 2 5
520 17 0 0 7 1 9.37 30 3 5
521 16 0 0 17 0 22.50 39 3 5
522 16 0 0 10 1 7.50 32 3 5
523 17 1 0 2 0 7.00 25 3 5
524 9 1 1 34 1 5.75 49 1 5
525 15 0 1 11 0 7.67 32 3 5
526 15 0 0 10 0 12.50 31 3 5
527 12 1 0 12 0 16.00 30 3 5
528 16 0 1 6 1 11.79 28 3 5
529 18 0 0 5 0 11.36 29 3 5
530 12 0 1 33 0 6.10 51 1 5
531 17 0 1 25 1 23.25 48 1 5
532 12 1 0 13 1 19.88 31 3 5
533 16 0 0 33 0 15.38 55 3 5
SECTOR MARR
0 1 1
1 1 1
2 1 0
3 0 0
4 0 1
5 0 0
6 0 0
7 0 0
8 1 1
9 0 0
10 0 1
11 1 0
12 0 1
13 0 0
14 0 1
15 2 1
16 0 1
17 1 1
18 0 0
19 0 1
20 1 1
21 1 1
22 0 0
23 0 1
24 0 1
25 1 1
26 1 1
27 0 1
28 1 1
29 0 1
.. ... ...
504 0 0
505 0 0
506 0 1
507 0 1
508 0 1
509 0 1
510 0 1
511 0 1
512 0 1
513 0 1
514 0 1
515 0 0
516 0 0
517 0 0
518 0 1
519 0 1
520 0 1
521 1 1
522 0 1
523 0 1
524 0 1
525 0 1
526 0 0
527 0 1
528 0 0
529 0 0
530 0 1
531 0 1
532 0 1
533 1 1
[534 rows x 11 columns]
```
### 3.1.4.1 配对图: 散点矩阵
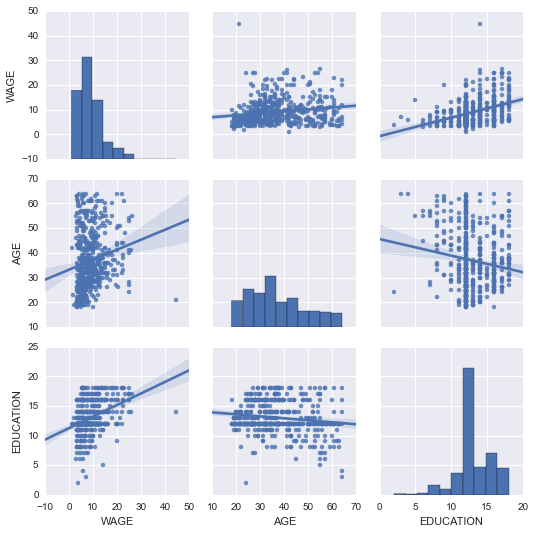
使用[seaborn.pairplot()](http://stanford.edu/~mwaskom/software/seaborn/generated/seaborn.pairplot.html#seaborn.pairplot)来显示散点矩阵我们可以很轻松的对连续变量之间的交互有一个直觉:
In [4]:
```
import seaborn
seaborn.pairplot(data, vars=['WAGE', 'AGE', 'EDUCATION'], kind='reg')
```
Out[4]:
```
<seaborn.axisgrid.PairGrid at 0x107feb850>
```
```
/Library/Frameworks/Python.framework/Versions/2.7/lib/python2.7/site-packages/matplotlib/collections.py:590: FutureWarning: elementwise comparison failed; returning scalar instead, but in the future will perform elementwise comparison
if self._edgecolors == str('face'):
```
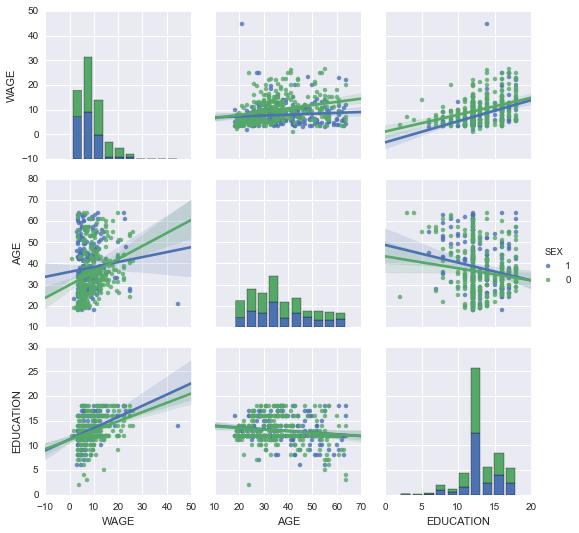
可以用颜色来绘制类别变量:
In [5]:
```
seaborn.pairplot(data, vars=['WAGE', 'AGE', 'EDUCATION'], kind='reg', hue='SEX')
```
Out[5]:
```
<seaborn.axisgrid.PairGrid at 0x107feb650>
```
**看一下并感受一些matplotlib设置**
Seaborn改变了matplotlib的默认图案以便获得更"现代"、更"类似Excel"的外观。它是通过import来实现的。重置默认设置可以使用:
In [8]:
```
from matplotlib import pyplot as plt
plt.rcdefaults()
```
要切换回seaborn设置, 或者更好理解seaborn中的样式, 见[seaborn文档中的相关部分](http://stanford.edu/~mwaskom/software/seaborn/tutorial/aesthetics.html)。
### 3.1.4.2\. lmplot: 绘制一个单变量回归
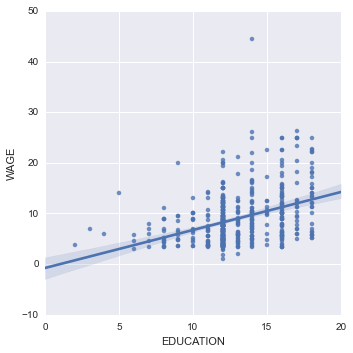
回归捕捉了一个变量与另一个变量的关系,例如薪水和教育,可以用[seaborn.lmplot()](http://stanford.edu/~mwaskom/software/seaborn/generated/seaborn.lmplot.html#seaborn.lmplot)来绘制:
In [6]:
```
seaborn.lmplot(y='WAGE', x='EDUCATION', data=data)
```
Out[6]:
```
<seaborn.axisgrid.FacetGrid at 0x108db6050>
```
**稳健回归**
在上图中,有一些数据点偏离了右侧的主要云,他们可能是异常值,对总体没有代表性,但是,推动了回归。
要计算对异常值不敏感的回归,必须使用[稳健模型](https://en.wikipedia.org/wiki/Robust_statistics)。在seaborn的绘图函数中可以使用`robust=True`,或者在statsmodels用"稳健线性回归"`statsmodels.formula.api.rlm()`来替换OLS。
## 3.1.5 交互作用检验

是否教育对工资的提升在男性中比女性中更多?
上图来自两个不同的拟合。我们需要公式化一个简单的模型来检验总体倾斜的差异。这通过"交互作用"来完成。
In [22]:
```
result = ols(formula='WAGE ~ EDUCATION + C(SEX) + EDUCATION * C(SEX)', data=data).fit()
print(result.summary())
```
```
OLS Regression Results
==============================================================================
Dep. Variable: WAGE R-squared: 0.190
Model: OLS Adj. R-squared: 0.186
Method: Least Squares F-statistic: 41.50
Date: Thu, 19 Nov 2015 Prob (F-statistic): 4.24e-24
Time: 12:06:38 Log-Likelihood: -1575.0
No. Observations: 534 AIC: 3158.
Df Residuals: 530 BIC: 3175.
Df Model: 3
Covariance Type: nonrobust
=========================================================================================
coef std err t P>|t| [95.0% Conf. Int.]
-----------------------------------------------------------------------------------------
Intercept 1.1046 1.314 0.841 0.401 -1.476 3.685
C(SEX)[T.1] -4.3704 2.085 -2.096 0.037 -8.466 -0.274
EDUCATION 0.6831 0.099 6.918 0.000 0.489 0.877
EDUCATION:C(SEX)[T.1] 0.1725 0.157 1.098 0.273 -0.136 0.481
==============================================================================
Omnibus: 208.151 Durbin-Watson: 1.863
Prob(Omnibus): 0.000 Jarque-Bera (JB): 1278.081
Skew: 1.587 Prob(JB): 2.94e-278
Kurtosis: 9.883 Cond. No. 170.
==============================================================================
Warnings:
[1] Standard Errors assume that the covariance matrix of the errors is correctly specified.
```
我们可以得出结论教育对男性的益处大于女性吗?
**带回家的信息**
* 假设检验和p-值告诉你影响 / 差异的**显著性**
* **公式** (带有类别变量) 让你可以表达你数据中的丰富联系
* **可视化**数据和简单模型拟合很重要!
* **条件化** (添加可以解释所有或部分方差的因素) 在改变交互作用建模方面非常重要。
## 3.1.6 完整例子
### [3.1.6.1 例子](http://www.scipy-lectures.org/packages/statistics/auto_examples/index.html)
#### [3.1.6.1.1 代码例子](http://www.scipy-lectures.org/packages/statistics/auto_examples/index.html#code-examples)
#### [3.1.6.1.2 课程练习的答案](http://www.scipy-lectures.org/packages/statistics/auto_examples/index.html#solutions-to-the-exercises-of-the-course)
2.8 与C进行交互
最后更新于:2022-04-01 11:21:54
# 2.8 与C进行交互
In [1]:
```
%matplotlib inline
import numpy as np
```
> **作者**: Valentin Haenel
本章包含了许多可以在Python使用原生代码(主要是C/C++)方式的_介绍_,这个过程通常被称为_封装_。本章的目的是给你有哪些技术存在已经各自有优劣式的一点儿感觉,这样你可以根据你的具体需求选择适合的方式。无论如何,只要你开始做封装,你几乎都必然需要咨询你选定技术的文档。
章节内容
```
简介
Python-C-Api
Ctypes
SWIG
Cython
总结
进一步阅读和参考
练习
```
## 2.8.1 简介
本章将涵盖一下技术:
* Python-C-Api
* Ctypes
* SWIG (简化封装器和接口生成器)
* Cython
这四种技术可能是最知名的,其中Cython可能是最高级的,并且你应该最优先使用它。其他的技术也很重要,如果你想要从不同点角度理解封装问题。之前提到过,还有其他的替代技术,但是,理解了以上这些基础的,你就可以评估你选择的技术是否满足你的需求。
在评估技术时,下列标准会有帮助:
* 需要额外的库吗?
* 代码可以自动生成?
* 是否需要编译?
* 与Numpy数组交互是否有良好的支持?
* 是否支持C++?
在你动手前,应该先考虑一下使用情景。在于原生代码交互时,通常来自于两个应用场景:
* 需要利用C/C++中现存的代码,或者是因为它已经存在,或者是因为它更快。
* Python代码太慢,将内部循环变成原生代码
每个技术都使用来自math.h的`cos`函数的封装来进行演示。尽管这是一个无聊例子,但是它确实给我们很好的演示了封装方法的基础,因为每个技术也包含了一定程度Numpy支持,这也用计算一些数组来计算consine的例子来演示。
最后,两个小警示:
* 所有这些方法在Python解释器中都可能崩溃(细分错误),因为在C代码中的错误。
* 所有的例子都在Linux中完成,他们应该在其他操作系统中也可用。
* 在大多数例子中,你都会需要C编译器。
## 2.8.2 Python-C-Api
Python-C-API是标准Python解释器(即CPython)的基础。使用这个API可以在C和C++中写Python扩展模块。很明显,由于语言兼容性的优点,这些扩展模块可以调用任何用C或者C++写的函数。
当使用Python-C-API时,人们通常写许多样板化的代码,首先解析函数接收的参数,然后构建返回的类型。
**优点**
* 不需要额外的库
* 许多系层的控制
* C++完全可用
**不足**
* 可以需要一定的努力
* 高代码成本
* 必须编译
* 高维护成本
* 如果C-API改变无法向前兼容Python版本
* 引用计数错误很容易出现,但是很难被跟踪。
**注意** 此处的Python-C-Api例子主要是用来演示。许多其他例子的确依赖它,因此,对于它如何工作有一个高层次的理解。在99%的使用场景下,使用替代技术会更好。
**注意** 因为引用计数很容易出现然而很难被跟踪,任何需要使用Python C-API的人都应该阅读[官方Python文档关于对象、类型和引用计数的部分](https://docs.python.org/2/c-api/intro.html#objects-types-and-reference-counts)。此外,有一个名为[cpychecker](https://gcc-python-plugin.readthedocs.org/en/latest/cpychecker.html)的工具可以发现引用计数的常见错误。
### 2.8.2.1 例子
下面的C扩展模块,让来自标准`math`库的`cos`函数在Python中可用:
In [ ]:
```
/* 用Python-C-API封装来自math.h的cos函数的例子 */
#include <Python.h>
#include <math.h>
/* wrapped cosine function */
static PyObject* cos_func(PyObject* self, PyObject* args)
{
double value;
double answer;
/* parse the input, from python float to c double */
if (!PyArg_ParseTuple(args, "d", &value))
return NULL;
/* if the above function returns -1, an appropriate Python exception will
* have been set, and the function simply returns NULL
*/
/* call cos from libm */
answer = cos(value);
/* construct the output from cos, from c double to python float */
return Py_BuildValue("f", answer);
}
/* define functions in module */
static PyMethodDef CosMethods[] =
{
{"cos_func", cos_func, METH_VARARGS, "evaluate the cosine"},
{NULL, NULL, 0, NULL}
};
/* module initialization */
PyMODINIT_FUNC
initcos_module(void)
{
(void) Py_InitModule("cos_module", CosMethods);
}
```
如你所见,有许多样板,既包括 «massage» 的参数和return类型以及模块初始化。尽管随着扩展的增长,这些东西中的一些是分期偿还,模板每个函数需要的模板还是一样的。
标准python构建系统`distutils`支持从`setup.py`编译C-扩展, 非常方便:
In [ ]:
```
from distutils.core import setup, Extension
# 定义扩展模块
cos_module = Extension('cos_module', sources=['cos_module.c'])
# 运行setup
setup(ext_modules=[cos_module])
```
这可以被编译:
```
$ cd advanced/interfacing_with_c/python_c_api
$ ls
cos_module.c setup.py
$ python setup.py build_ext --inplace
running build_ext
building 'cos_module' extension
creating build
creating build/temp.linux-x86_64-2.7
gcc -pthread -fno-strict-aliasing -g -O2 -DNDEBUG -g -fwrapv -O3 -Wall -Wstrict-prototypes -fPIC -I/home/esc/anaconda/include/python2.7 -c cos_module.c -o build/temp.linux-x86_64-2.7/cos_module.o
gcc -pthread -shared build/temp.linux-x86_64-2.7/cos_module.o -L/home/esc/anaconda/lib -lpython2.7 -o /home/esc/git-working/scipy-lecture-notes/advanced/interfacing_with_c/python_c_api/cos_module.so
$ ls
build/ cos_module.c cos_module.so setup.py
```
* `build_ext` 是构建扩展模块
* `--inplace` 将把编译后的扩展模块输出到当前目录
文件`cos_module.so`包含编译后的扩展,我们可以在IPython解释器中加载它:
In [ ]:
```
In [1]: import cos_module
In [2]: cos_module?
Type: module
String Form:<module 'cos_module' from 'cos_module.so'>
File: /home/esc/git-working/scipy-lecture-notes/advanced/interfacing_with_c/python_c_api/cos_module.so
Docstring: <no docstring>
In [3]: dir(cos_module)
Out[3]: ['__doc__', '__file__', '__name__', '__package__', 'cos_func']
In [4]: cos_module.cos_func(1.0)
Out[4]: 0.5403023058681398
In [5]: cos_module.cos_func(0.0)
Out[5]: 1.0
In [6]: cos_module.cos_func(3.14159265359)
Out[7]: -1.0
```
现在我们看一下这有多强壮:
In [ ]:
```
In [10]: cos_module.cos_func('foo')
---------------------------------------------------------------------------
TypeError Traceback (most recent call last)
<ipython-input-10-11bee483665d> in <module>()
----> 1 cos_module.cos_func('foo')
TypeError: a float is required
```
### 2.8.2.2\. Numpy 支持
Numpy模拟Python-C-API, 自身也实现了C-扩展, 产生了Numpy-C-API。这个API可以被用来创建和操作来自C的Numpy数组, 当写一个自定义的C-扩展。也可以看一下:参考:`advanced_numpy`。
**注意** 如果你确实需要使用Numpy C-API参考关于[Arrays](http://docs.scipy.org/doc/numpy/reference/c-api.array.html)和[Iterators](http://docs.scipy.org/doc/numpy/reference/c-api.iterator.html)的文档。
下列的例子显示如何将Numpy数组作为参数传递给函数,以及如果使用(旧)Numpy-C-API在Numpy数组上迭代。它只是将一个数组作为参数应用到来自`math.h`的cosine函数,并且返回生成的新数组。
In [ ]:
```
/* 使用Numpy-C-API封装来自math.h的cos函数 . */
#include <Python.h>
#include <numpy/arrayobject.h>
#include <math.h>
/* 封装cosine函数 */
static PyObject* cos_func_np(PyObject* self, PyObject* args)
{
PyArrayObject *in_array;
PyObject *out_array;
NpyIter *in_iter;
NpyIter *out_iter;
NpyIter_IterNextFunc *in_iternext;
NpyIter_IterNextFunc *out_iternext;
/* parse single numpy array argument */
if (!PyArg_ParseTuple(args, "O!", &PyArray_Type, &in_array))
return NULL;
/* construct the output array, like the input array */
out_array = PyArray_NewLikeArray(in_array, NPY_ANYORDER, NULL, 0);
if (out_array == NULL)
return NULL;
/* create the iterators */
in_iter = NpyIter_New(in_array, NPY_ITER_READONLY, NPY_KEEPORDER,
NPY_NO_CASTING, NULL);
if (in_iter == NULL)
goto fail;
out_iter = NpyIter_New((PyArrayObject *)out_array, NPY_ITER_READWRITE,
NPY_KEEPORDER, NPY_NO_CASTING, NULL);
if (out_iter == NULL) {
NpyIter_Deallocate(in_iter);
goto fail;
}
in_iternext = NpyIter_GetIterNext(in_iter, NULL);
out_iternext = NpyIter_GetIterNext(out_iter, NULL);
if (in_iternext == NULL || out_iternext == NULL) {
NpyIter_Deallocate(in_iter);
NpyIter_Deallocate(out_iter);
goto fail;
}
double ** in_dataptr = (double **) NpyIter_GetDataPtrArray(in_iter);
double ** out_dataptr = (double **) NpyIter_GetDataPtrArray(out_iter);
/* iterate over the arrays */
do {
**out_dataptr = cos(**in_dataptr);
} while(in_iternext(in_iter) && out_iternext(out_iter));
/* clean up and return the result */
NpyIter_Deallocate(in_iter);
NpyIter_Deallocate(out_iter);
Py_INCREF(out_array);
return out_array;
/* in case bad things happen */
fail:
Py_XDECREF(out_array);
return NULL;
}
/* 在模块中定义函数 */
static PyMethodDef CosMethods[] =
{
{"cos_func_np", cos_func_np, METH_VARARGS,
"evaluate the cosine on a numpy array"},
{NULL, NULL, 0, NULL}
};
/* 模块初始化 */
PyMODINIT_FUNC
initcos_module_np(void)
{
(void) Py_InitModule("cos_module_np", CosMethods);
/* IMPORTANT: this must be called */
import_array();
}
```
要编译这个模块,我们可以再用`distutils`。但是我们需要通过使用func:numpy.get_include确保包含了Numpy头部:
In [ ]:
```
from distutils.core import setup, Extension
import numpy
# define the extension module
cos_module_np = Extension('cos_module_np', sources=['cos_module_np.c'],
include_dirs=[numpy.get_include()])
# run the setup
setup(ext_modules=[cos_module_np])
```
要说服我们自己这个方式确实有效,我们来跑一下下面的测试脚本:
In [ ]:
```
import cos_module_np
import numpy as np
import pylab
x = np.arange(0, 2 * np.pi, 0.1)
y = cos_module_np.cos_func_np(x)
pylab.plot(x, y)
pylab.show()
```
这会产生以下的图像:

## 2.8.3\. Ctypes
Ctypes是Python的一个外来函数库。它提供了C兼容的数据类型,并且允许在DLLs或者共享的库中调用函数。它可以用来在纯Python中封装这些库。
**优点**
* Python标准库的一部分
* 不需要编译
* 代码封装都是在Python中
**不足**
* 需要代码作为一个共享的库(粗略地说,在windows中是 *.dll,在Linux中是*.so,在Mac OSX中是 *.dylib)
* 对C++支持并不好
### 2.8.3.1 例子
如前面提到的,代码封装完全在Python中。
In [ ]:
```
""" 用ctypes封装来自math.h的 cos 函数。 """
import ctypes
from ctypes.util import find_library
# find and load the library
libm = ctypes.cdll.LoadLibrary(find_library('m'))
# set the argument type
libm.cos.argtypes = [ctypes.c_double]
# set the return type
libm.cos.restype = ctypes.c_double
def cos_func(arg):
''' 封装math.h cos函数 '''
return libm.cos(arg)
```
* 寻找和加载库可能非常依赖于你的操作系统,检查[文档](https://docs.python.org/2/library/ctypes.html#loading-dynamic-link-libraries)来了解细节
* 这可能有些欺骗性,因为math库在系统中已经是编译模式。如果你想要封装一个内置的库,需要先编译它,可能需要或者不需要额外的工作。 我们现在可以像前面一样使用这个库:
In [ ]:
```
In [1]: import cos_module
In [2]: cos_module?
Type: module
String Form:<module 'cos_module' from 'cos_module.py'>
File: /home/esc/git-working/scipy-lecture-notes/advanced/interfacing_with_c/ctypes/cos_module.py
Docstring: <no docstring>
In [3]: dir(cos_module)
Out[3]:
['__builtins__',
'__doc__',
'__file__',
'__name__',
'__package__',
'cos_func',
'ctypes',
'find_library',
'libm']
In [4]: cos_module.cos_func(1.0)
Out[4]: 0.5403023058681398
In [5]: cos_module.cos_func(0.0)
Out[5]: 1.0
In [6]: cos_module.cos_func(3.14159265359)
Out[6]: -1.0
```
### 2.8.3.2 Numpy支持
Numpy包含一些与ctypes交互的支持。特别是支持将特定Numpy数组属性作为ctypes数据类型研究,并且有函数可以将C数组和Numpy数据互相转换。
更多信息,可以看一下Numpy手册的对应部分或者`numpy.ndarray.ctypes`和`numpy.ctypeslib`的API文档。
对于下面的例子,让我们假设一个C函数,输入输出都是一个数组,计算输入数组的cosine并将结果输出为一个数组。
库包含下列头文件(尽管在这个例子中并不是必须这样,为了完整,我们还是把这一步列出来):
In [ ]:
```
void cos_doubles(double * in_array, double * out_array, int size);
```
这个函数实现在下列的C源文件中:
In [ ]:
```
#include <math.h>
/* Compute the cosine of each element in in_array, storing the result in
* out_array. */
void cos_doubles(double * in_array, double * out_array, int size){
int i;
for(i=0;i<size;i++){
out_array[i] = cos(in_array[i]);
}
}
```
并且因为这个库是纯C的,我们不能使用`distutils`来编译,但是,必须使用`make`和`gcc`的组合:
In [ ]:
```
m.PHONY : clean
libcos_doubles.so : cos_doubles.o
gcc -shared -Wl,-soname,libcos_doubles.so -o libcos_doubles.so cos_doubles.o
cos_doubles.o : cos_doubles.c
gcc -c -fPIC cos_doubles.c -o cos_doubles.o
clean :
-rm -vf libcos_doubles.so cos_doubles.o cos_doubles.pyc
```
接下来,我们可以将这个库编译到共享的库 (on Linux)`libcos_doubles.so`:
In [ ]:
```
$ ls
cos_doubles.c cos_doubles.h cos_doubles.py makefile test_cos_doubles.py
$ make
gcc -c -fPIC cos_doubles.c -o cos_doubles.o
gcc -shared -Wl,-soname,libcos_doubles.so -o libcos_doubles.so cos_doubles.o
$ ls
cos_doubles.c cos_doubles.o libcos_doubles.so* test_cos_doubles.py
cos_doubles.h cos_doubles.py makefile
```
现在我们可以继续通过ctypes对Numpy数组的直接支持(一定程度上)来封装这个库:
In [ ]:
```
""" 封装一个使用numpy.ctypeslib接受C双数组作为输入的例子。"""
import numpy as np
import numpy.ctypeslib as npct
from ctypes import c_int
# cos_doubles的输入类型
# 必须是双数组, 有相邻的单维度
array_1d_double = npct.ndpointer(dtype=np.double, ndim=1, flags='CONTIGUOUS')
# 加载库,运用numpy机制
libcd = npct.load_library("libcos_doubles", ".")
# 设置反馈类型和参数类型
libcd.cos_doubles.restype = None
libcd.cos_doubles.argtypes = [array_1d_double, array_1d_double, c_int]
def cos_doubles_func(in_array, out_array):
return libcd.cos_doubles(in_array, out_array, len(in_array))
```
* 注意临近单维度Numpy数组的固有限制,因为C函数需要这类的缓存器。
* 也需要注意输出数组也需要是预分配的,例如[numpy.zeros()](http://docs.scipy.org/doc/numpy/reference/generated/numpy.zeros.html#numpy.zeros)和函数将用它的缓存器来写。
* 尽管`cos_doubles`函数的原始签名是`ARRAY`, `ARRAY`, `int`最终的`cos_doubles_func`需要两个Numpy数组作为参数。
并且,和前面一样,我们我要为自己证明一下它是有效的:
In [ ]:
```
import numpy as np
import pylab
import cos_doubles
x = np.arange(0, 2 * np.pi, 0.1)
y = np.empty_like(x)
cos_doubles.cos_doubles_func(x, y)
pylab.plot(x, y)
pylab.show()
```

## 2.8.4 SWIG
[SWIG](http://www.swig.org/), 简化封装接口生成器,是一个联接用C和C++写的程序与需要高级程序语言,包括Python的软件开发工具。SWIG的重点在于它可以为你自动生成封装器代码。尽管从编程时间上来说这是一个优势,但是同时也是一个负担。生成的文件通常很大,并且可能并不是人类可读的,封装过程造成的多层间接引用可能很难理解。
**注意** 自动生成的C代码使用Python-C-Api。
**优势**
* 给定头部可以自动封装整个库
* 在C++中表现良好
**不足**
* 自动生成的文件很庞大
* 如果出错很难debug
* 陡峭的学习曲线
### 2.8.4.1 例子
让我们想象我们的`cos`函数存在于用C写的`cos_module`中,包含在源文件`cos_module.c`中:
In [ ]:
```
#include <math.h>
double cos_func(double arg){
return cos(arg);
}
```
头文件`cos_module.h`:
In [ ]:
```
double cos_func(double arg);
```
尽管我们的目的是将`cos_func`暴露给Python。要用SWIG来完成这个目的,我们需要写一个包含SWIG指导的接口文件。
In [ ]:
```
/* Example of wrapping cos function from math.h using SWIG. */
%module cos_module
%{
/* the resulting C file should be built as a python extension */
#define SWIG_FILE_WITH_INIT
/* Includes the header in the wrapper code */
#include "cos_module.h"
%}
/* Parse the header file to generate wrappers */
%include "cos_module.h"
```
如你所见,这里不需要太多的代码。对于这个简单的例子,它简单到只需要在接口文件中包含一个头文件,来向Python暴露函数。但是,SWIG确实允许更多精细包含或者排除在头文件中发现的函数,细节检查一下文档。
生成编译的封装器是一个两阶段的过程:
* 在接口文件上运行`swig`可执行文件来生成文件`cos_module_wrap.c`, 其源文件是自动生成的Python C-extension和`cos_module.py`, 是自动生成的Python模块。
* 编译`cos_module_wrap.c`到`_cos_module.so`。幸运的,`distutils`知道如何处理SWIG接口文件, 因此我们的`setup.py`是很简单的:
In [ ]:
```
from distutils.core import setup, Extension
setup(ext_modules=[Extension("_cos_module",
sources=["cos_module.c", "cos_module.i"])])
```
In [ ]:
```
$ cd advanced/interfacing_with_c/swig
$ ls
cos_module.c cos_module.h cos_module.i setup.py
$ python setup.py build_ext --inplace
running build_ext
building '_cos_module' extension
swigging cos_module.i to cos_module_wrap.c
swig -python -o cos_module_wrap.c cos_module.i
creating build
creating build/temp.linux-x86_64-2.7
gcc -pthread -fno-strict-aliasing -g -O2 -DNDEBUG -g -fwrapv -O3 -Wall -Wstrict-prototypes -fPIC -I/home/esc/anaconda/include/python2.7 -c cos_module.c -o build/temp.linux-x86_64-2.7/cos_module.o
gcc -pthread -fno-strict-aliasing -g -O2 -DNDEBUG -g -fwrapv -O3 -Wall -Wstrict-prototypes -fPIC -I/home/esc/anaconda/include/python2.7 -c cos_module_wrap.c -o build/temp.linux-x86_64-2.7/cos_module_wrap.o
gcc -pthread -shared build/temp.linux-x86_64-2.7/cos_module.o build/temp.linux-x86_64-2.7/cos_module_wrap.o -L/home/esc/anaconda/lib -lpython2.7 -o /home/esc/git-working/scipy-lecture-notes/advanced/interfacing_with_c/swig/_cos_module.so
$ ls
build/ cos_module.c cos_module.h cos_module.i cos_module.py _cos_module.so* cos_module_wrap.c setup.py
```
我们可以像前面的例子中那样加载和运行`cos_module`:
In [ ]:
```
In [1]: import cos_module
In [2]: cos_module?
Type: module
String Form:<module 'cos_module' from 'cos_module.py'>
File: /home/esc/git-working/scipy-lecture-notes/advanced/interfacing_with_c/swig/cos_module.py
Docstring: <no docstring>
In [3]: dir(cos_module)
Out[3]:
['__builtins__',
'__doc__',
'__file__',
'__name__',
'__package__',
'_cos_module',
'_newclass',
'_object',
'_swig_getattr',
'_swig_property',
'_swig_repr',
'_swig_setattr',
'_swig_setattr_nondynamic',
'cos_func']
In [4]: cos_module.cos_func(1.0)
Out[4]: 0.5403023058681398
In [5]: cos_module.cos_func(0.0)
Out[5]: 1.0
In [6]: cos_module.cos_func(3.14159265359)
Out[6]: -1.0
```
接下来我们测试一下强壮性,我们看到我们可以获得一个更多的错误信息 (虽然, 严格来讲在Python中没有double类型):
In [ ]:
```
In [7]: cos_module.cos_func('foo')
---------------------------------------------------------------------------
TypeError Traceback (most recent call last)
<ipython-input-7-11bee483665d> in <module>()
----> 1 cos_module.cos_func('foo')
TypeError: in method 'cos_func', argument 1 of type 'double'
```
### 2.8.4.2 Numpy 支持
Numpy在`numpy.i`文件中提供了[SWIG的支持](http://docs.scipy.org/doc/numpy/reference/swig.html)。这个接口文件定义了许多所谓的typemaps,支持了Numpy数组和C-Arrays的转化。在接下来的例子中,我们将快速看一下typemaps实际是如何工作的。
我们有相同的`cos_doubles`函数,在ctypes例子中:
In [ ]:
```
void cos_doubles(double * in_array, double * out_array, int size);
```
In [ ]:
```
#include <math.h>
/* Compute the cosine of each element in in_array, storing the result in
* out_array. */
void cos_doubles(double * in_array, double * out_array, int size){
int i;
for(i=0;i<size;i++){
out_array[i] = cos(in_array[i]);
}
}
```
使用了SWIG接口文件封装了`cos_doubles_func`:
In [ ]:
```
/* Example of wrapping a C function that takes a C double array as input using
* numpy typemaps for SWIG. */
%module cos_doubles
%{
/* the resulting C file should be built as a python extension */
#define SWIG_FILE_WITH_INIT
/* Includes the header in the wrapper code */
#include "cos_doubles.h"
%}
/* include the numpy typemaps */
%include "numpy.i"
/* need this for correct module initialization */
%init %{
import_array();
%}
/* typemaps for the two arrays, the second will be modified in-place */
%apply (double* IN_ARRAY1, int DIM1) {(double * in_array, int size_in)}
%apply (double* INPLACE_ARRAY1, int DIM1) {(double * out_array, int size_out)}
/* Wrapper for cos_doubles that massages the types */
%inline %{
/* takes as input two numpy arrays */
void cos_doubles_func(double * in_array, int size_in, double * out_array, int size_out) {
/* calls the original funcion, providing only the size of the first */
cos_doubles(in_array, out_array, size_in);
}
%}
```
* 要使用Numpy的typemaps, 我们需要包含`numpy.i`文件。
* 观察一下对`import_array()`的调用,这个模块我们已经在Numpy-C-API例子中遇到过。
* 因为类型映射只支持ARRAY、SIZE的签名,我们需要将cos_doubles封装为cos_doubles_func,接收两个数组包括大小作为输入。
* 与SWIG不同的是, 我们并没有包含`cos_doubles.h`头部,我们并不需要暴露给Python,因为,我们通过`cos_doubles_func`暴露了相关的功能。
并且,和之前一样,我们可以用`distutils`来封装这个函数:
In [ ]:
```
from distutils.core import setup, Extension
import numpy
setup(ext_modules=[Extension("_cos_doubles",
sources=["cos_doubles.c", "cos_doubles.i"],
include_dirs=[numpy.get_include()])])
```
和前面一样,我们需要用`include_dirs`来制定位置。
In [ ]:
```
$ ls
cos_doubles.c cos_doubles.h cos_doubles.i numpy.i setup.py test_cos_doubles.py
$ python setup.py build_ext -i
running build_ext
building '_cos_doubles' extension
swigging cos_doubles.i to cos_doubles_wrap.c
swig -python -o cos_doubles_wrap.c cos_doubles.i
cos_doubles.i:24: Warning(490): Fragment 'NumPy_Backward_Compatibility' not found.
cos_doubles.i:24: Warning(490): Fragment 'NumPy_Backward_Compatibility' not found.
cos_doubles.i:24: Warning(490): Fragment 'NumPy_Backward_Compatibility' not found.
creating build
creating build/temp.linux-x86_64-2.7
gcc -pthread -fno-strict-aliasing -g -O2 -DNDEBUG -g -fwrapv -O3 -Wall -Wstrict-prototypes -fPIC -I/home/esc/anaconda/lib/python2.7/site-packages/numpy/core/include -I/home/esc/anaconda/include/python2.7 -c cos_doubles.c -o build/temp.linux-x86_64-2.7/cos_doubles.o
gcc -pthread -fno-strict-aliasing -g -O2 -DNDEBUG -g -fwrapv -O3 -Wall -Wstrict-prototypes -fPIC -I/home/esc/anaconda/lib/python2.7/site-packages/numpy/core/include -I/home/esc/anaconda/include/python2.7 -c cos_doubles_wrap.c -o build/temp.linux-x86_64-2.7/cos_doubles_wrap.o
In file included from /home/esc/anaconda/lib/python2.7/site-packages/numpy/core/include/numpy/ndarraytypes.h:1722,
from /home/esc/anaconda/lib/python2.7/site-packages/numpy/core/include/numpy/ndarrayobject.h:17,
from /home/esc/anaconda/lib/python2.7/site-packages/numpy/core/include/numpy/arrayobject.h:15,
from cos_doubles_wrap.c:2706:
/home/esc/anaconda/lib/python2.7/site-packages/numpy/core/include/numpy/npy_deprecated_api.h:11:2: warning: #warning "Using deprecated NumPy API, disable it by #defining NPY_NO_DEPRECATED_API NPY_1_7_API_VERSION"
gcc -pthread -shared build/temp.linux-x86_64-2.7/cos_doubles.o build/temp.linux-x86_64-2.7/cos_doubles_wrap.o -L/home/esc/anaconda/lib -lpython2.7 -o /home/esc/git-working/scipy-lecture-notes/advanced/interfacing_with_c/swig_numpy/_cos_doubles.so
$ ls
build/ cos_doubles.h cos_doubles.py cos_doubles_wrap.c setup.py
cos_doubles.c cos_doubles.i _cos_doubles.so* numpy.i test_cos_doubles.py
```
并且,和前面一样,我们来验证一下它工作正常:
In [ ]:
```
import numpy as np
import pylab
import cos_doubles
x = np.arange(0, 2 * np.pi, 0.1)
y = np.empty_like(x)
cos_doubles.cos_doubles_func(x, y)
pylab.plot(x, y)
pylab.show()
```

## 2.8.5 Cython
Cython既是写C扩展的类Python语言,也是这种语言的编译器。Cython语言是Python的超集,带有额外的结构,允许你调用C函数和C类型的注释变量和类属性。在这个意义上,可以称之为带有类型的Python。
除了封装原生代码的基础应用案例,Cython也支持额外的应用案例,即交互优化。从根本上来说,从纯Python脚本开始,向瓶颈代码逐渐增加Cython类型来优化那些确实有影响的代码。
在这种情况下,与SWIG很相似,因为代码可以自动生成,但是,从另一个角度来说,又与ctypes很类似,因为,封装代码(大部分)是用Python写的。
尽管其他自动生成代码的解决方案很难debug(比如SWIG),Cython有一个GNU debugger扩展来帮助debug Python,Cython和C代码。
**注意** 自动生成的C代码使用Python-C-Api。
**优点**
* 类Python语言来写扩展
* 自动生成代码
* 支持增量优化
* 包含一个GNU debugger扩展
* 支持C++ (从版本0.13) **不足**
* 必须编译
* 需要额外的库 ( 只是在build的时候, 在这个问题中,可以通过运送生成的C文件来克服)
### 2.8.5.1 例子
`cos_module`的主要Cython代码包含在文件`cos_module.pyx`中:
In [ ]:
```
""" Example of wrapping cos function from math.h using Cython. """
cdef extern from "math.h":
double cos(double arg)
def cos_func(arg):
return cos(arg)
```
注意额外的关键词,比如`cdef`和`extern`。同时,`cos_func`也是纯Python。
和前面一样,我们可以使用标准的`distutils`模块,但是,这次我们需要一些来自于`Cython.Distutils`的更多代码:
In [ ]:
```
from distutils.core import setup, Extension
from Cython.Distutils import build_ext
setup(
cmdclass={'build_ext': build_ext},
ext_modules=[Extension("cos_module", ["cos_module.pyx"])]
)
```
编译这个模块:
In [ ]:
```
$ cd advanced/interfacing_with_c/cython
$ ls
cos_module.pyx setup.py
$ python setup.py build_ext --inplace
running build_ext
cythoning cos_module.pyx to cos_module.c
building 'cos_module' extension
creating build
creating build/temp.linux-x86_64-2.7
gcc -pthread -fno-strict-aliasing -g -O2 -DNDEBUG -g -fwrapv -O3 -Wall -Wstrict-prototypes -fPIC -I/home/esc/anaconda/include/python2.7 -c cos_module.c -o build/temp.linux-x86_64-2.7/cos_module.o
gcc -pthread -shared build/temp.linux-x86_64-2.7/cos_module.o -L/home/esc/anaconda/lib -lpython2.7 -o /home/esc/git-working/scipy-lecture-notes/advanced/interfacing_with_c/cython/cos_module.so
$ ls
build/ cos_module.c cos_module.pyx cos_module.so* setup.py
```
并且运行:
In [ ]:
```
In [1]: import cos_module
In [2]: cos_module?
Type: module
String Form:<module 'cos_module' from 'cos_module.so'>
File: /home/esc/git-working/scipy-lecture-notes/advanced/interfacing_with_c/cython/cos_module.so
Docstring: <no docstring>
In [3]: dir(cos_module)
Out[3]:
['__builtins__',
'__doc__',
'__file__',
'__name__',
'__package__',
'__test__',
'cos_func']
In [4]: cos_module.cos_func(1.0)
Out[4]: 0.5403023058681398
In [5]: cos_module.cos_func(0.0)
Out[5]: 1.0
In [6]: cos_module.cos_func(3.14159265359)
Out[6]: -1.0
```
并且,测试一下强壮性,我们可以看到我们得到了更好的错误信息:
In [ ]:
```
In [7]: cos_module.cos_func('foo')
---------------------------------------------------------------------------
TypeError Traceback (most recent call last)
<ipython-input-7-11bee483665d> in <module>()
----> 1 cos_module.cos_func('foo')
/home/esc/git-working/scipy-lecture-notes/advanced/interfacing_with_c/cython/cos_module.so in cos_module.cos_func (cos_module.c:506)()
TypeError: a float is required
```
此外,不需要Cython完全传输到C math库的声明,上面的代码可以简化为:
In [ ]:
```
""" Simpler example of wrapping cos function from math.h using Cython. """
from libc.math cimport cos
def cos_func(arg):
return cos(arg)
```
在这种情况下,`cimport`语句用于导入`cos`函数。
### 2.8.5.2 Numpy支持
Cython通过`numpy.pyx`文件支持Numpy,允许你为你的Cython代码添加Numpy数组类型,即就像指定变量`i`是`int`类型,你也可以指定变量`a`是带有给定的`dtype`的`numpy.ndarray`。同时,同时特定的优化比如边际检查也是支持的。看一下[Cython文档](http://docs.cython.org/src/tutorial/numpy.html)的对应部分。如果你想要将Numpy数组作为C数组传递给Cython封装的C函数,在[Cython wiki](http://wiki.cython.org/tutorials/NumpyPointerToC)上有对应的部分。
在下面的例子中,我们将演示如何用Cython来封装类似的`cos_doubles`。
In [ ]:
```
void cos_doubles(double * in_array, double * out_array, int size);
```
In [ ]:
```
#include <math.h>
/* Compute the cosine of each element in in_array, storing the result in
* out_array. */
void cos_doubles(double * in_array, double * out_array, int size){
int i;
for(i=0;i<size;i++){
out_array[i] = cos(in_array[i]);
}
}
```
这个函数使用下面的Cython代码来封装`cos_doubles_func`:
In [ ]:
```
""" Example of wrapping a C function that takes C double arrays as input using
the Numpy declarations from Cython """
# cimport the Cython declarations for numpy
cimport numpy as np
# if you want to use the Numpy-C-API from Cython
# (not strictly necessary for this example, but good practice)
np.import_array()
# cdefine the signature of our c function
cdef extern from "cos_doubles.h":
void cos_doubles (double * in_array, double * out_array, int size)
# create the wrapper code, with numpy type annotations
def cos_doubles_func(np.ndarray[double, ndim=1, mode="c"] in_array not None,
np.ndarray[double, ndim=1, mode="c"] out_array not None):
cos_doubles(<double*> np.PyArray_DATA(in_array),
<double*> np.PyArray_DATA(out_array),
in_array.shape[0])
```
可以使用`distutils`来编译:
In [ ]:
```
from distutils.core import setup, Extension
import numpy
from Cython.Distutils import build_ext
setup(
cmdclass={'build_ext': build_ext},
ext_modules=[Extension("cos_doubles",
sources=["_cos_doubles.pyx", "cos_doubles.c"],
include_dirs=[numpy.get_include()])],
)
```
与前面的编译Numpy例子类似,我们需要`include_dirs`选项。
In [ ]:
```
$ ls
cos_doubles.c cos_doubles.h _cos_doubles.pyx setup.py test_cos_doubles.py
$ python setup.py build_ext -i
running build_ext
cythoning _cos_doubles.pyx to _cos_doubles.c
building 'cos_doubles' extension
creating build
creating build/temp.linux-x86_64-2.7
gcc -pthread -fno-strict-aliasing -g -O2 -DNDEBUG -g -fwrapv -O3 -Wall -Wstrict-prototypes -fPIC -I/home/esc/anaconda/lib/python2.7/site-packages/numpy/core/include -I/home/esc/anaconda/include/python2.7 -c _cos_doubles.c -o build/temp.linux-x86_64-2.7/_cos_doubles.o
In file included from /home/esc/anaconda/lib/python2.7/site-packages/numpy/core/include/numpy/ndarraytypes.h:1722,
from /home/esc/anaconda/lib/python2.7/site-packages/numpy/core/include/numpy/ndarrayobject.h:17,
from /home/esc/anaconda/lib/python2.7/site-packages/numpy/core/include/numpy/arrayobject.h:15,
from _cos_doubles.c:253:
/home/esc/anaconda/lib/python2.7/site-packages/numpy/core/include/numpy/npy_deprecated_api.h:11:2: warning: #warning "Using deprecated NumPy API, disable it by #defining NPY_NO_DEPRECATED_API NPY_1_7_API_VERSION"
/home/esc/anaconda/lib/python2.7/site-packages/numpy/core/include/numpy/__ufunc_api.h:236: warning: ‘_import_umath’ defined but not used
gcc -pthread -fno-strict-aliasing -g -O2 -DNDEBUG -g -fwrapv -O3 -Wall -Wstrict-prototypes -fPIC -I/home/esc/anaconda/lib/python2.7/site-packages/numpy/core/include -I/home/esc/anaconda/include/python2.7 -c cos_doubles.c -o build/temp.linux-x86_64-2.7/cos_doubles.o
gcc -pthread -shared build/temp.linux-x86_64-2.7/_cos_doubles.o build/temp.linux-x86_64-2.7/cos_doubles.o -L/home/esc/anaconda/lib -lpython2.7 -o /home/esc/git-working/scipy-lecture-notes/advanced/interfacing_with_c/cython_numpy/cos_doubles.so
$ ls
build/ _cos_doubles.c cos_doubles.c cos_doubles.h _cos_doubles.pyx cos_doubles.so* setup.py test_cos_doubles.py
```
和前面一样,我们来验证一下它是有效的:
In [ ]:
```
import numpy as np
import pylab
import cos_doubles
x = np.arange(0, 2 * np.pi, 0.1)
y = np.empty_like(x)
cos_doubles.cos_doubles_func(x, y)
pylab.plot(x, y)
pylab.show()
```

### 2.8.6 总结
这个部分演示了四种与原生代码交互的技术。下表概述了这些技术的一些方面。
| x | Part of CPython | Compiled | Autogenerated | Numpy Support |
| --- | --- | --- | --- | --- |
| Python-C-API | True | True | False | True |
| Ctypes | True | False | False | True |
| Swig | False | True | True | True |
| Cython | False | True | True | True |
在上面的技术中,Cython是最现代最高级的。特别是,通过为Python代码添加类型来增量优化代码的技术是惟一的。
## 2.8.7 Further Reading and References
[Gaël Varoquaux关于避免数据复制的博客](http://gael-varoquaux.info/blog/?p=157)给出了一些如何精明的处理内存管理的见解。如果你在大数据量时出现问题,可以回到这里寻找一些灵感。
## 2.8.8 练习
因为这是一个新部分,练习更像是一个接下来应该查看什么的指示器,因此,看一下那些你觉得更有趣的部分。如果你有关于练习更好点子,请告诉我们!
* 下载每个例子的源码,并且在你的机器上运行并编译他们。
* 对每个例子做一些修改,并且自己验证一下是否有效。 ( 比如,将cos改为sin。)
* 绝大多数例子,特别是包含了Numpy的例子,可能还是比较脆弱,对输入错误反应较差。找一些方法来让例子崩溃,找出问题所在,并且设计潜在的解决方案。这些是有些点子:
* 数字溢出
* 输入输出数组长度不一致
* 多维度数据
* 空数组
* non-double类型数组
* 使用`%timeit`IPython魔法函数来测量不同解决方案的执行时间
### 2.8.8.1 Python-C-API
* 修改Numpy例子以便函数有两个输入参数,第二个参数是预分配输出数组,让它与其他的Numpy例子一致。
* 修改这个例子,以便这个函数只有一个输入数组,在原地修改这个函数。
* 试着用新的[Numpy迭代协议](http://docs.scipy.org/doc/numpy/reference/c-api.iterator.html)修改例子。如果你刚好获得了一个可用的解决方案,请将其提交一个请求到github。
* 你可能注意到了,Numpy-C-API例子只是Numpy例子没有封装`cos_doubles`但是直接将`cos`函数应用于Numpy数组的元素上。这样做与其他技术相比有什么优势。
* 你可以只用Numpy-C-API来封装`cos_doubles`。你可能需要确保数组有正确的类型,并且是单维度和内存临近。
### 2.8.8.2 Ctypes
* 修改Numpy例子以便`cos_doubles_func`为你处理预分配,让它更像Numpy-C-API例子。
### 2.8.8.3\. SWIG
* 看一下SWIG自动生成的代码,你能理解多少?
* 修改Numpy例子,以便`cos_doubles_func`为你处理预处理,让它更像Numpy-C-API例子。
* 修改`cos_doubles` C 函数,以便它返回分配的数组。你可以用SWIG typemaps类封装吗? 如果不可以,为什么不可以? 对于这种特殊的情况有没有什么变通方法? (提示: 你知道输出数组的大小, 因此,可以从返回的`double \*`构建Numpy数组。
### 2.8.8.4 Cython
* 看一下Cython自动生成的代码。仔细看一下Cython插入的一些评论。你能看到些什么?
* 看一下Cython文档中[与Numpy工作](http://docs.cython.org/src/tutorial/numpy.html)的部分, 学习一下如何使用Numpy增量优化python脚本。
* 修改Numpy例子,以便`cos_doubles_func`为你处理预处理,让它更像Numpy-C-API例子。
2.7 数学优化:找到函数的最优解
最后更新于:2022-04-01 11:21:52
# 2.7 数学优化:找到函数的最优解
In [2]:
```
%matplotlib inline
import numpy as np
```
> **作者**: Gaël Varoquaux
[数学优化](http://en.wikipedia.org/wiki/Mathematical_optimization)处理寻找一个函数的最小值(最大值或零)的问题。在这种情况下,这个函数被称为_成本函数_,或_目标函数_,或_能量_。
这里,我们感兴趣的是使用[scipy.optimize](http://docs.scipy.org/doc/scipy/reference/optimize.html#scipy.optimize)来进行黑盒优化: 我们不依赖于我们优化的函数的算术表达式。注意这个表达式通常可以用于高效的、非黑盒优化。
> 先决条件
>
> * Numpy, Scipy
> * matplotlib
**也可以看一下: 参考**
数学优化是非常 ... 数学的。如果你需要性能,那么很有必要读一下这些书:
* [Convex Optimization](http://www.stanford.edu/~boyd/cvxbook/) Boyd and Vandenberghe (pdf版线上免费)。
* [Numerical Optimization](http://users.eecs.northwestern.edu/~nocedal/book/num-opt.html), Nocedal and Wright。 关于梯度下降方法的详细参考。
* [Practical Methods of Optimization](http://www.amazon.com/gp/product/0471494631/ref=ox_sc_act_title_1?ie=UTF8&smid=ATVPDKIKX0DER) Fletcher: 擅长挥手解释。
**章节内容**
* 了解你的问题
* 凸优化 VS 非凸优化
* 平滑问题和非平滑问题
* 嘈杂VS精确的成本函数
* 限制
* 不同最优化方法的回顾
* 入门: 一维最优化
* 基于梯度的方法
* 牛顿和拟牛顿法
* 较少梯度方法
* 全局优化
* 使用scipy优化的操作指南
* 选择一个方法
* 让你的优化器更快
* 计算梯度
* 虚拟练习
* 特殊情境: 非线性最小二乘
* 最小化向量函数的范数
* 曲线拟合
* 有限制的最优化
* 箱边界
* 通用限制
## 2.7.1 了解你的问题
每个问题都是不相同。了解你的问题使你可以选择正确的工具。
**问题的维数**
优化问题的规模非常好的由问题的维数来决定,即,进行搜索的标量变量的数量。
### 2.7.1.1 凸优化 VS 非凸优化
**凸函数**:
* $f$ 在它的所有切线之上。
* 相应的, 对于两个点point A, B, f(C) 在线段[f(A), f(B])]之下, 如果 A < C < B

**非凸函数**

**最优化凸函数简单。最优化非凸函数可能非常困难。**
> **注意**: 可以证明对于一个凸函数局部最小值也是全局最小值。然后,从某种意义上说,最小值是惟一的。
### 2.7.1.2 平滑和非平滑问题
**平滑函数**:
梯度无处不在,是一个连续函数

**非平滑函数**:

**优化平滑函数更简单一些** (在黑盒最优化的前提是对的,此外[线性编程](http://en.wikipedia.org/wiki/Linear_programming)是一个非常高效处理分段线性函数的例子)。
### 2.7.1.3 嘈杂 VS 精确成本函数
有噪音 (blue) 和无噪音 (green) 函数

**噪音梯度**
许多优化方法都依赖于目标函数的梯度。如果没有给出梯度函数,会从数值上计算他们,会产生误差。在这种情况下,即使目标函数没有噪音,基于梯度的最优化也可能是噪音最优化。
### 2.7.1.4 限制
基于限制的最优化
这里是:
$-1 < x_1 < 1$
$-1 < x_2 < 1$

## 2.7.2 不同最优化方法的回顾
### 2.7.2.1 入门: 一维最优化
使用[scipy.optimize.brent()](http://docs.scipy.org/doc/scipy/reference/generated/scipy.optimize.brent.html#scipy.optimize.brent) 来最小化一维函数。它混合抛物线近似与区间策略。
**二元函数的Brent方法**: 在3次迭代后收敛, 因为,稍后二元近似精确了。


**非凸函数的Brent方法**: 注意最优化方法避免了局部最小值其实是因为运气。


In [4]:
```
from scipy import optimize
def f(x):
return -np.exp(-(x - .7)**2)
x_min = optimize.brent(f) # 实际上在9次迭代后收敛!
x_min
```
Out[4]:
```
0.6999999997839409
```
In [4]:
```
x_min - .7
```
Out[4]:
```
-2.160590595323697e-10
```
> **注意**: Brent方法也可以用于_限制区间最优化_使用[scipy.optimize.fminbound()](http://docs.scipy.org/doc/scipy/reference/generated/scipy.optimize.fminbound.html#scipy.optimize.fminbound)
>
> **注意**: 在scipy 0.11中, [scipy.optimize.minimize_scalar()](http://docs.scipy.org/doc/scipy/reference/generated/scipy.optimize.minimize_scalar.html#scipy.optimize.minimize_scalar) 给出了一个一维标量最优化的通用接口。
### 2.7.2.2 基于梯度的方法
#### 2.7.2.2.1 关于梯度下降的一些直觉
这里我们关注**直觉**,不是代码。代码在后面。
从根本上说,梯度下降在于在梯度方向上前进小步,即最陡峭梯度的方向。
**固定步数梯度下降**
**状况良好的二元函数。**


**状况糟糕的二元函数。**
状况糟糕问题的梯度下降算法的核心问题是梯度并不会指向最低点。


我们可以看到非常各向异性 (状况糟糕) 函数非常难优化。
**带回家的信息**: 条件数和预条件化
如果你知道变量的自然刻度,预刻度他们以便他们的行为相似。这与[预条件化](https://en.wikipedia.org/wiki/Preconditioner)相关。
并且,很明显采用大步幅是有优势的。这在梯度下降代码中使用[直线搜索](https://en.wikipedia.org/wiki/Line_search)。
**适应步数梯度下降**
状况良好的二元函数。


状况糟糕的二元函数。


状况糟糕的非二元函数。


状况糟糕的极端非二元函数。


函数看起来越像二元函数 (椭圆半圆边框线), 最优化越简单。
#### 2.7.2.2.2 共轭梯度下降
上面的梯度下降算法是玩具不会被用于真实的问题。
正如从上面例子中看到的,简单梯度下降算法的一个问题是,它试着摇摆穿越峡谷,每次跟随梯度的方法,以便穿越峡谷。共轭梯度通过添加_摩擦力_项来解决这个问题: 每一步依赖于前两个值的梯度然后急转弯减少了。
**共轭梯度下降**
状况糟糕的非二元函数。


状况糟糕的极端非二元函数。


在scipy中基于共轭梯度下降方法名称带有‘cg’。最小化函数的简单共轭梯度下降方法是[scipy.optimize.fmin_cg()](http://docs.scipy.org/doc/scipy/reference/generated/scipy.optimize.fmin_cg.html#scipy.optimize.fmin_cg):
In [5]:
```
def f(x): # The rosenbrock函数
return .5*(1 - x[0])**2 + (x[1] - x[0]**2)**2
optimize.fmin_cg(f, [2, 2])
```
```
Optimization terminated successfully.
Current function value: 0.000000
Iterations: 13
Function evaluations: 120
Gradient evaluations: 30
```
Out[5]:
```
array([ 0.99998968, 0.99997855])
```
这些方法需要函数的梯度。方法可以计算梯度,但是如果传递了梯度性能将更好:
In [6]:
```
def fprime(x):
return np.array((-2*.5*(1 - x[0]) - 4*x[0]*(x[1] - x[0]**2), 2*(x[1] - x[0]**2)))
optimize.fmin_cg(f, [2, 2], fprime=fprime)
```
```
Optimization terminated successfully.
Current function value: 0.000000
Iterations: 13
Function evaluations: 30
Gradient evaluations: 30
```
Out[6]:
```
array([ 0.99999199, 0.99998336])
```
注意函数只会评估30次,相对的没有梯度是120次。
### 2.7.2.3 牛顿和拟牛顿法
#### 2.7.2.3.1 牛顿法: 使用Hessian (二阶微分))
[牛顿法](http://en.wikipedia.org/wiki/Newton%27s_method_in_optimization)使用局部二元近似来计算跳跃的方向。为了这个目的,他们依赖于函数的前两个导数_梯度_和[Hessian](http://en.wikipedia.org/wiki/Hessian_matrix)。
**状况糟糕的二元函数:**
注意,因为二元近似是精确的,牛顿法是非常快的。


**状况糟糕的非二元函数:**
这里我们最优化高斯分布,通常在它的二元近似的下面。因此,牛顿法超调量并且导致震荡。


**状况糟糕的极端非二元函数:**


在scipy中, 最优化的牛顿法在[scipy.optimize.fmin_ncg()](http://docs.scipy.org/doc/scipy/reference/generated/scipy.optimize.fmin_ncg.html#scipy.optimize.fmin_ncg)实现 (cg这里是指一个内部操作的事实,Hessian翻转, 使用共轭梯度来进行)。[scipy.optimize.fmin_tnc()](http://docs.scipy.org/doc/scipy/reference/generated/scipy.optimize.fmin_tnc.html#scipy.optimize.fmin_tnc) 可以被用于限制问题,尽管没有那么多用途:
In [7]:
```
def f(x): # rosenbrock函数
return .5*(1 - x[0])**2 + (x[1] - x[0]**2)**2
def fprime(x):
return np.array((-2*.5*(1 - x[0]) - 4*x[0]*(x[1] - x[0]**2), 2*(x[1] - x[0]**2)))
optimize.fmin_ncg(f, [2, 2], fprime=fprime)
```
```
Optimization terminated successfully.
Current function value: 0.000000
Iterations: 9
Function evaluations: 11
Gradient evaluations: 51
Hessian evaluations: 0
```
Out[7]:
```
array([ 1., 1.])
```
注意与共轭梯度(上面的)相比,牛顿法需要较少的函数评估,更多的梯度评估,因为它使用它近似Hessian。让我们计算Hessian并将它传给算法:
In [7]:
```
def hessian(x): # Computed with sympy
return np.array(((1 - 4*x[1] + 12*x[0]**2, -4*x[0]), (-4*x[0], 2)))
optimize.fmin_ncg(f, [2, 2], fprime=fprime, fhess=hessian)
```
```
Optimization terminated successfully.
Current function value: 0.000000
Iterations: 9
Function evaluations: 11
Gradient evaluations: 19
Hessian evaluations: 9
```
Out[7]:
```
array([ 1., 1.])
```
> **注意**:在超高维,Hessian的翻转代价高昂并且不稳定 (大规模 > 250)。
>
> **注意**:牛顿最优化算法不应该与基于相同原理的牛顿根发现法相混淆,[scipy.optimize.newton()](http://docs.scipy.org/doc/scipy/reference/generated/scipy.optimize.newton.html#scipy.optimize.newton)。
#### 2.7.2.3.2 拟牛顿方法: 进行着近似Hessian
**BFGS**: BFGS (Broyden-Fletcher-Goldfarb-Shanno算法) 改进了每一步对Hessian的近似。
**状况糟糕的二元函数:**
在准确的二元函数中, BFGS并不像牛顿法那么快,但是还是很快。


**状况糟糕的非二元函数:**
这种情况下BFGS比牛顿好, 因为它的曲度经验估计比Hessian给出的好。


**状况糟糕的极端非二元函数:**


In [9]:
```
def f(x): # rosenbrock函数
return .5*(1 - x[0])**2 + (x[1] - x[0]**2)**2
def fprime(x):
return np.array((-2*.5*(1 - x[0]) - 4*x[0]*(x[1] - x[0]**2), 2*(x[1] - x[0]**2)))
optimize.fmin_bfgs(f, [2, 2], fprime=fprime)
```
```
Optimization terminated successfully.
Current function value: 0.000000
Iterations: 16
Function evaluations: 24
Gradient evaluations: 24
```
Out[9]:
```
array([ 1.00000017, 1.00000026])
```
**L-BFGS**: 限制内存的BFGS介于BFGS和共轭梯度之间: 在非常高的维度 (> 250) 计算和翻转的Hessian矩阵的成本非常高。L-BFGS保留了低秩的版本。此外,scipy版本, [scipy.optimize.fmin_l_bfgs_b()](http://docs.scipy.org/doc/scipy/reference/generated/scipy.optimize.fmin_l_bfgs_b.html#scipy.optimize.fmin_l_bfgs_b), 包含箱边界:
In [8]:
```
def f(x): # rosenbrock函数
return .5*(1 - x[0])**2 + (x[1] - x[0]**2)**2
def fprime(x):
return np.array((-2*.5*(1 - x[0]) - 4*x[0]*(x[1] - x[0]**2), 2*(x[1] - x[0]**2)))
optimize.fmin_l_bfgs_b(f, [2, 2], fprime=fprime)
```
Out[8]:
```
(array([ 1.00000005, 1.00000009]),
1.4417677473011859e-15,
{'funcalls': 17,
'grad': array([ 1.02331202e-07, -2.59299369e-08]),
'nit': 16,
'task': 'CONVERGENCE: NORM_OF_PROJECTED_GRADIENT_<=_PGTOL',
'warnflag': 0})
```
> **注意**:如果你不为L-BFGS求解器制定梯度,你需要添加approx_grad=1
### 2.7.2.4 较少梯度方法
#### 2.7.2.4.1 打靶法: Powell算法
接近梯度方法
**状态糟糕的二元函数:**
Powell法对低维局部糟糕状况并不很敏感


**状况糟糕的极端非二元函数:**


#### 2.7.2.4.2 单纯形法: Nelder-Mead
Nelder-Mead算法是对高维空间的对立方法的归纳。这个算法通过改进[单纯形](http://en.wikipedia.org/wiki/Simplex)来工作,高维空间间隔和三角形的归纳,包裹最小值。
**长处**: 对噪音很强壮,他不依赖于计算梯度。因此,它可以在局部光滑的函数上工作,比如实验数据点,只要他显示了一个大规模的钟形行为。但是,它在光滑、非噪音函数上比基于梯度的方法慢。
**状况糟糕的非二元函数:**


**状况糟糕的极端非二元函数:**


在scipy中, [scipy.optimize.fmin()](http://docs.scipy.org/doc/scipy/reference/generated/scipy.optimize.fmin.html#scipy.optimize.fmin) 实现了Nelder-Mead法:
In [11]:
```
def f(x): # rosenbrock函数
return .5*(1 - x[0])**2 + (x[1] - x[0]**2)**2
optimize.fmin(f, [2, 2])
```
```
Optimization terminated successfully.
Current function value: 0.000000
Iterations: 46
Function evaluations: 91
```
Out[11]:
```
array([ 0.99998568, 0.99996682])
```
### 2.7.2.5 全局最优化算法
如果你的问题不允许惟一的局部最低点(很难测试除非是凸函数),如果你没有先前知识来让优化起点接近答案,你可能需要全局最优化算法。
#### 2.7.2.5.1 暴力: 网格搜索
[scipy.optimize.brute()](http://docs.scipy.org/doc/scipy/reference/generated/scipy.optimize.brute.html#scipy.optimize.brute)在 函数网格内来评价函数,根据最小值返回参数。参数由[numpy.mgrid](http://docs.scipy.org/doc/numpy/reference/generated/numpy.mgrid.html#numpy.mgrid)给出的范围来指定。默认情况下,每个方向进行20步:
In [4]:
```
def f(x): # rosenbrock函数
return .5*(1 - x[0])**2 + (x[1] - x[0]**2)**2
optimize.brute(f, ((-1, 2), (-1, 2)))
```
Out[4]:
```
array([ 1.00001462, 1.00001547])
```
## 2.7.3 使用scipy优化的现实指南
### 2.7.3.1 选择一个方法

**没有关于梯度的知识:**
* 一般来说,倾向于BFGS ([scipy.optimize.fmin_bfgs()](http://docs.scipy.org/doc/scipy/reference/generated/scipy.optimize.fmin_bfgs.html#scipy.optimize.fmin_bfgs)) 或 L-BFGS (), 即使你有大概的数值梯度
* 在状况良好的问题上,Powell () 以及 Nelder-Mead ([scipy.optimize.fmin()](http://docs.scipy.org/doc/scipy/reference/generated/scipy.optimize.fmin.html#scipy.optimize.fmin)), 都是在高维上效果良好的梯度自有的方法,但是 ,他们无法支持状况糟糕的问题。
**有关于梯度的知识:**
* BFGS ([scipy.optimize.fmin_bfgs()](http://docs.scipy.org/doc/scipy/reference/generated/scipy.optimize.fmin_bfgs.html#scipy.optimize.fmin_bfgs)) 或 L-BFGS ([scipy.optimize.fmin_l_bfgs_b()](http://docs.scipy.org/doc/scipy/reference/generated/scipy.optimize.fmin_l_bfgs_b.html#scipy.optimize.fmin_l_bfgs_b))。
* BFGS的计算开支要大于L-BFGS, 它自身也比共轭梯度法开销大。另一方面,BFGS通常比CG(共轭梯度法)需要更少函数评估。因此,共轭梯度法在优化计算量较少的函数时比BFGS更好。
**带有Hessian**:
* 如果你可以计算Hessian, 推荐牛顿法 ([scipy.optimize.fmin_ncg()](http://docs.scipy.org/doc/scipy/reference/generated/scipy.optimize.fmin_ncg.html#scipy.optimize.fmin_ncg))。
**如果有噪音测量**:
使用Nelder-Mead ([scipy.optimize.fmin()](http://docs.scipy.org/doc/scipy/reference/generated/scipy.optimize.fmin.html#scipy.optimize.fmin)) 或者 Powell ([scipy.optimize.fmin_powell()](http://docs.scipy.org/doc/scipy/reference/generated/scipy.optimize.fmin_powell.html#scipy.optimize.fmin_powell))。
### 2.7.3.2 让优化器更快
* 选择正确的方法 (见上面), 如果可以的话,计算梯度和Hessia。
* 可能的时候使用[preconditionning](http://en.wikipedia.org/wiki/Preconditioner)。
* 聪明的选择你的起点。例如,如果你正在运行许多相似的优化,那么在其他结果上软启动。
* 如果你不需要准确,那么请放松并容忍
### 2.7.3.3 计算梯度
计算梯度甚至是Hessians的努力, 是枯燥的但是也是值得的。使用[Sympy](http://www.scipy-lectures.org/packages/sympy.html#sympy)来进行象征计算将非常方便。
优化不能很好收敛的一个来源是计算梯度过程的人为错误。你可以用[scipy.optimize.check_grad()](http://docs.scipy.org/doc/scipy/reference/generated/scipy.optimize.check_grad.html#scipy.optimize.check_grad)来检查一下梯度是否正确。它返回给出的梯度与计算的梯度之间差异的基准:
In [9]:
```
optimize.check_grad(f, fprime, [2, 2])
```
Out[9]:
```
2.384185791015625e-07
```
也看一下[scipy.optimize.approx_fprime()](http://docs.scipy.org/doc/scipy/reference/generated/scipy.optimize.approx_fprime.html#scipy.optimize.approx_fprime)找一下你的错误。
#### 2.7.3.4 合成练习
**练习: 简单的 (?) 二次函数**

用K[0]作为起始点优化下列函数:
In [2]:
```
np.random.seed(0)
K = np.random.normal(size=(100, 100))
def f(x):
return np.sum((np.dot(K, x - 1))**2) + np.sum(x**2)**2
```
计时你的方法。找到最快的方法。为什么BFGS不好用了?
**练习:局部扁平最小化**


考虑一下函数$exp(-1/(.1*x^2 + y^2)$。这个函数在(0,0)存在一个最小值。从起点(1,1)开始,试着在$1e-8$达到这个最低点。
## 2.7.4 特殊案例: 非线性最小二乘
### 2.7.4.1 最小化向量函数的基准
最小二乘法,向量函数基准值的最小化,有特定的结构可以用在[scipy.optimize.leastsq()](http://docs.scipy.org/doc/scipy/reference/generated/scipy.optimize.leastsq.html#scipy.optimize.leastsq)中实现的[Levenberg–Marquardt 算法](https://en.wikipedia.org/wiki/Levenberg-Marquardt_algorithm)。
让我们试一下最小化下面向量函数的基准:
In [5]:
```
def f(x):
return np.arctan(x) - np.arctan(np.linspace(0, 1, len(x)))
x0 = np.zeros(10)
optimize.leastsq(f, x0)
```
Out[5]:
```
(array([ 0\. , 0.11111111, 0.22222222, 0.33333333, 0.44444444,
0.55555556, 0.66666667, 0.77777778, 0.88888889, 1\. ]), 2)
```
这用了67次函数评估(用'full_output=1'试一下)。如果我们自己计算基准并且使用一个更好的通用优化器(BFGS)会怎么样:
In [6]:
```
def g(x):
return np.sum(f(x)**2)
optimize.fmin_bfgs(g, x0)
```
```
Optimization terminated successfully.
Current function value: 0.000000
Iterations: 11
Function evaluations: 144
Gradient evaluations: 12
```
Out[6]:
```
array([ -7.44987291e-09, 1.11112265e-01, 2.22219893e-01,
3.33331914e-01, 4.44449794e-01, 5.55560493e-01,
6.66672149e-01, 7.77779758e-01, 8.88882036e-01,
1.00001026e+00])
```
BFGS需要更多的函数调用,并且给出了一个并不精确的结果。
注意只有当输出向量的维度非常大,比需要优化的函数还要大,`leastsq`与BFGS相类比才是有趣的。
如果函数是线性的,这是一个线性代数问题,应该用[scipy.linalg.lstsq()](http://docs.scipy.org/doc/scipy/reference/generated/scipy.linalg.lstsq.html#scipy.linalg.lstsq)解决。
### 2.7.4.2 曲线拟合

最小二乘问题通常出现在拟合数据的非线性拟合时。当我们自己构建优化问题时,scipy提供了这种目的的一个帮助函数: [scipy.optimize.curve_fit()](http://docs.scipy.org/doc/scipy/reference/generated/scipy.optimize.curve_fit.html#scipy.optimize.curve_fit):
In [7]:
```
def f(t, omega, phi):
return np.cos(omega * t + phi)
x = np.linspace(0, 3, 50)
y = f(x, 1.5, 1) + .1*np.random.normal(size=50)
optimize.curve_fit(f, x, y)
```
Out[7]:
```
(array([ 1.50600889, 0.98754323]), array([[ 0.00030286, -0.00045233],
[-0.00045233, 0.00098838]]))
```
**练习**
用omega = 3来进行相同的练习。困难是什么?
## 2.7.5 有限制条件的优化
### 2.7.5.1 箱边界

箱边界是指限制优化的每个函数。注意一些最初不是写成箱边界的问题可以通过改变变量重写。
* [scipy.optimize.fminbound()](http://docs.scipy.org/doc/scipy/reference/generated/scipy.optimize.fminbound.html#scipy.optimize.fminbound)进行一维优化
* [scipy.optimize.fmin_l_bfgs_b()](http://docs.scipy.org/doc/scipy/reference/generated/scipy.optimize.fmin_l_bfgs_b.html#scipy.optimize.fmin_l_bfgs_b)带有边界限制的quasi-Newton方法:
In [8]:
```
def f(x):
return np.sqrt((x[0] - 3)**2 + (x[1] - 2)**2)
optimize.fmin_l_bfgs_b(f, np.array([0, 0]), approx_grad=1, bounds=((-1.5, 1.5), (-1.5, 1.5)))
```
Out[8]:
```
(array([ 1.5, 1.5]),
1.5811388300841898,
{'funcalls': 12,
'grad': array([-0.94868331, -0.31622778]),
'nit': 2,
'task': 'CONVERGENCE: NORM_OF_PROJECTED_GRADIENT_<=_PGTOL',
'warnflag': 0})
```
### 2.7.5.2 通用限制
相等和不相等限制特定函数: f(x) = 0 and g(x)< 0。

* [scipy.optimize.fmin_slsqp()](http://docs.scipy.org/doc/scipy/reference/generated/scipy.optimize.fmin_slsqp.html#scipy.optimize.fmin_slsqp) 序列最小二乘程序: 相等和不相等限制:
In [10]:
```
def f(x):
return np.sqrt((x[0] - 3)**2 + (x[1] - 2)**2)
def constraint(x):
return np.atleast_1d(1.5 - np.sum(np.abs(x)))
optimize.fmin_slsqp(f, np.array([0, 0]), ieqcons=[constraint, ])
```
```
Optimization terminated successfully. (Exit mode 0)
Current function value: 2.47487373504
Iterations: 5
Function evaluations: 20
Gradient evaluations: 5
```
Out[10]:
```
array([ 1.25004696, 0.24995304])
```
* [scipy.optimize.fmin_cobyla()](http://docs.scipy.org/doc/scipy/reference/generated/scipy.optimize.fmin_cobyla.html#scipy.optimize.fmin_cobyla)通过线性估计的限定优化:只有不相等限制:
In [11]:
```
optimize.fmin_cobyla(f, np.array([0, 0]), cons=constraint)
```
Out[11]:
```
array([ 1.25009622, 0.24990378])
```
上面这个问题在统计中被称为[Lasso](http://en.wikipedia.org/wiki/Lasso_(statistics)#LASSO_method)问题, 有许多解决它的高效方法 (比如在[scikit-learn](http://scikit-learn.org/)中)。一般来说,当特定求解器存在时不需要使用通用求解器。
**拉格朗日乘子法**
如果你有足够的数学知识,许多限定优化问题可以被转化为非限定性优化问题,使用被称为拉格朗日乘子法的数学技巧。
2.6 使用Numpy和Scipy进行图像操作及处理
最后更新于:2022-04-01 11:21:49
# 2.6 使用Numpy和Scipy进行图像操作及处理
In [3]:
```
%matplotlib inline
import numpy as np
```
**作者**:Emmanuelle Gouillart, Gaël Varoquaux
这个部分解决用核心的科学模块NumPy和SciPy做基本的图像操作和处理。这个教程中涵盖的一些操作可能对于一些其他类型的多维度数据处理比对图像处理更加有用。特别是,子摸块[scipy.ndimage](http://docs.scipy.org/doc/scipy/reference/ndimage.html#module-scipy.ndimage)提供了在N维Numpy数组上操作的方法。
**也看一下:** 对于更高级的图像处理和图像特有的程序,见专注于[skimage](http://scikit-image.org/docs/stable/api/skimage.html#module-skimage)模块教程[Scikit-image: 图像处理](http://www.scipy-lectures.org/packages/scikit-image/index.html#scikit-image)。
**图像 = 2-D 数值数组**
(或者 3-D: CT, MRI, 2D + time; 4-D, ...)
这里, **图像 == Numpy 数组** `np.array`
**本教程中使用的工具:**
* `numpy`: 基础的数组操作
* `scipy`: `scipy.ndimage` 专注于图像处理的子模块 (n维 图像)。见[文档](http://docs.scipy.org/doc/scipy/reference/tutorial/ndimage.html):
In [1]:
```
from scipy import ndimage
```
**图像处理中的常见任务:**
* 输入/输出、显示图像
* 基础操作: 剪切, 翻转、旋转...
* 图像过滤: 降噪, 锐化
* 图形分割: 根据不同的对象标记像素
* 分类
* 特征提取
* 配准
* ...
**章节内容**
```
打开和写入图像文件
显示图像
基础操作
统计信息
几何图像变换
图像过滤
模糊/光滑
锐化
降噪
数学形态学
特征提取
边缘检测
分隔
测量对象属性: ndimage.measurements
```
## 2.6.1 打开和写入图像文件
将数组写入文件:
In [4]:
```
from scipy import misc
f = misc.face()
misc.imsave('face.png', f) # 使用图像模块 (PIL)
import matplotlib.pyplot as plt
plt.imshow(f)
plt.show()
```

从图像文件创建一个numpy数组:
In [5]:
```
from scipy import misc
face = misc.face()
misc.imsave('face.png', face) # 首先我们需要创建这个PNG文件
face = misc.imread('face.png')
type(face)
```
Out[5]:
```
numpy.ndarray
```
In [6]:
```
face.shape, face.dtype
```
Out[6]:
```
((768, 1024, 3), dtype('uint8'))
```
对于8位的图像 (0-255) dtype是uint8
打开raw文件 (照相机, 3-D 图像)
In [7]:
```
face.tofile('face.raw') # 创建raw文件
face_from_raw = np.fromfile('face.raw', dtype=np.uint8)
face_from_raw.shape
```
Out[7]:
```
(2359296,)
```
In [8]:
```
face_from_raw.shape = (768, 1024, 3)
```
需要知道图像的shape和dtype (如何去分离数据类型)。
对于大数据, 使用`np.memmap`来做内存映射:
In [9]:
```
face_memmap = np.memmap('face.raw', dtype=np.uint8, shape=(768, 1024, 3))
```
(数据从文件中读取,并没有加载到内存)
处理一组图像文件
In [10]:
```
for i in range(10):
im = np.random.random_integers(0, 255, 10000).reshape((100, 100))
misc.imsave('random_%02d.png' % i, im)
from glob import glob
filelist = glob('random*.png')
filelist.sort()
```
## 2.6.2 显示图像
使用`matplotlib`和`imshow`在`matplotlib图形内部`显示图像:
In [11]:
```
f = misc.face(gray=True) # 取回灰度图像
import matplotlib.pyplot as plt
plt.imshow(f, cmap=plt.cm.gray)
```
Out[11]:
```
<matplotlib.image.AxesImage at 0x10afb0bd0>
```
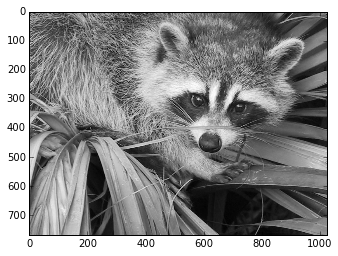
通过设置最小和最大值增加对比度:
In [14]:
```
plt.imshow(f, cmap=plt.cm.gray, vmin=30, vmax=200)
```
Out[14]:
```
<matplotlib.image.AxesImage at 0x110f8c6d0>
```

In [16]:
```
plt.imshow(f, cmap=plt.cm.gray, vmin=30, vmax=200)
# 删除座标轴和刻度
plt.axis('off')
```
Out[16]:
```
(-0.5, 1023.5, 767.5, -0.5)
```

画出轮廓线:
In [18]:
```
plt.imshow(f, cmap=plt.cm.gray, vmin=30, vmax=200)
# 删除座标轴和刻度
plt.axis('off')
plt.contour(f, [50, 200])
```
Out[18]:
```
<matplotlib.contour.QuadContourSet instance at 0x10cab5878>
```

[[Python 源代码]](http://www.scipy-lectures.org/advanced/image_processing/auto_examples/plot_display_face.html#example-plot-display-face-py)
对于要精确检查的密度变量,使用`interpolation='nearest'`:
In [19]:
```
plt.imshow(f[320:340, 510:530], cmap=plt.cm.gray)
```
Out[19]:
```
<matplotlib.image.AxesImage at 0x10590da90>
```
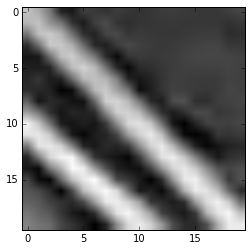
In [20]:
```
plt.imshow(f[320:340, 510:530], cmap=plt.cm.gray, interpolation='nearest')
```
Out[20]:
```
<matplotlib.image.AxesImage at 0x110716c10>
```
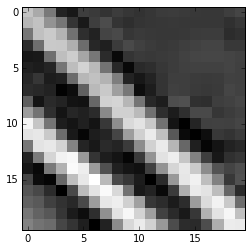
[[Python 源代码]](http://www.scipy-lectures.org/advanced/image_processing/auto_examples/plot_interpolation_face.html#example-plot-interpolation-face-py)
**也可以看一下** 3-D 可视化: Mayavi
见[使用Mayavi的3D绘图](http://www.scipy-lectures.org/packages/3d_plotting/index.html#mayavi-label)。
* Image plane widgets
* Isosurfaces
* ...
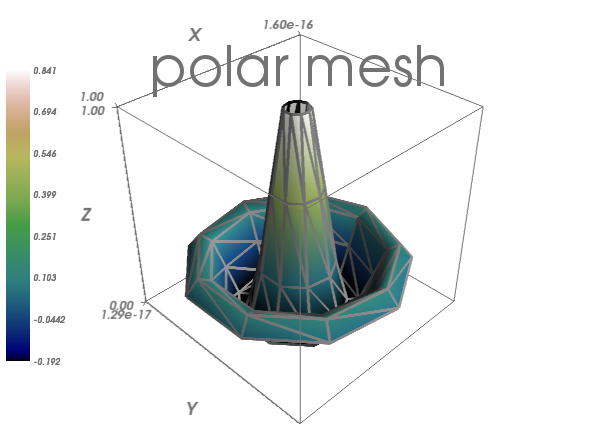
## 2.6.3 基础操作
图像是数组: 使用完整的numpy机制。
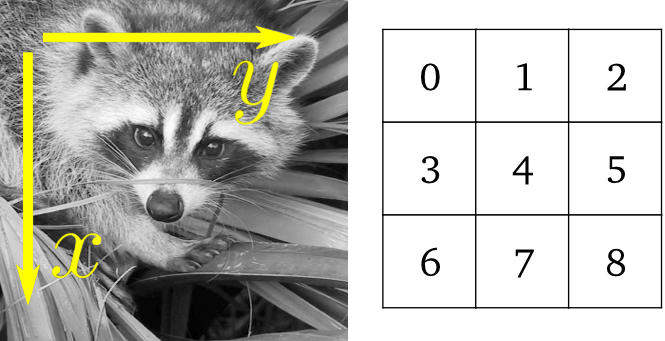
In [21]:
```
face = misc.face(gray=True)
face[0, 40]
```
Out[21]:
```
127
```
In [22]:
```
# 切片
face[10:13, 20:23]
```
Out[22]:
```
array([[141, 153, 145],
[133, 134, 125],
[ 96, 92, 94]], dtype=uint8)
```
In [24]:
```
face[100:120] = 255
lx, ly = face.shape
X, Y = np.ogrid[0:lx, 0:ly]
mask = (X - lx / 2) ** 2 + (Y - ly / 2) ** 2 > lx * ly / 4
# 掩码(masks)
face[mask] = 0
# 象征索引(Fancy indexing)
face[range(400), range(400)] = 255
```

[[Python source code]](http://www.scipy-lectures.org/advanced/image_processing/auto_examples/plot_numpy_array.html#example-plot-numpy-array-py)
### 2.6.3.1 统计信息
In [26]:
```
face = misc.face(gray=True)
face.mean()
```
Out[26]:
```
113.48026784261067
```
In [27]:
```
face.max(), face.min()
```
Out[27]:
```
(250, 0)
```
`np.histogram`
**练习**
* 将`scikit-image` logo作为数组打开 ([http://scikit-image.org/_static/img/logo.png](http://scikit-image.org/_static/img/logo.png)), 或者在你电脑上的其他图像。
* 剪切图像的有意义部分,例如,logo中的python圆形。
* 用`matplotlib`显示图像数组。改变interpolation方法并且放大看一下差异。
* 将你的图像改变为灰度
* 通过改变它的最小最大值增加图像的对比度。**选做:**使用`scipy.stats.scoreatpercentile` (读一下文本字符串!) 来饱和最黑5%的像素和最亮5%的像素。
* 将数组保存为两个不同的文件格式 (png, jpg, tiff)

### 2.6.3.2 几何图像变换
In [28]:
```
face = misc.face(gray=True)
lx, ly = face.shape
# 剪切
crop_face = face[lx / 4: - lx / 4, ly / 4: - ly / 4]
# up <-> down 翻转
flip_ud_face = np.flipud(face)
# 旋转
rotate_face = ndimage.rotate(face, 45)
rotate_face_noreshape = ndimage.rotate(face, 45, reshape=False)
```

[[Python source code]](http://www.scipy-lectures.org/advanced/image_processing/auto_examples/plot_geom_face.html#example-plot-geom-face-py)
## 2.6.4 图像过滤
**局部过滤器**: 通过临近像素值的函数来替换像素的值。
**邻居**: 方块 (选择大小)、 硬盘、或者更复杂的结构化元素。

### 2.6.4.1 模糊 / 光滑
**高斯过滤器** 来自 `scipy.ndimage`:
In [29]:
```
from scipy import misc
face = misc.face(gray=True)
blurred_face = ndimage.gaussian_filter(face, sigma=3)
very_blurred = ndimage.gaussian_filter(face, sigma=5)
```
**均匀过滤器**
In [30]:
```
local_mean = ndimage.uniform_filter(face, size=11)
```

[[Python source code]](http://www.scipy-lectures.org/advanced/image_processing/auto_examples/plot_blur.html)
### 2.6.4.2 锐化
锐化模糊的图像:
In [31]:
```
from scipy import misc
face = misc.face(gray=True).astype(float)
blurred_f = ndimage.gaussian_filter(face, 3)
```
通过添加Laplacian的近似值来增加边缘的权重:
In [32]:
```
filter_blurred_f = ndimage.gaussian_filter(blurred_f, 1)
alpha = 30
sharpened = blurred_f + alpha * (blurred_f - filter_blurred_f)
```

[[Python source code]](http://www.scipy-lectures.org/advanced/image_processing/auto_examples/plot_sharpen.html#example-plot-sharpen-py)
### 2.6.4.3 降噪
有噪音的脸:
In [33]:
```
from scipy import misc
f = misc.face(gray=True)
f = f[230:290, 220:320]
noisy = f + 0.4 * f.std() * np.random.random(f.shape)
```
**高斯过滤器**光滑了噪音... 以及边缘:
In [34]:
```
gauss_denoised = ndimage.gaussian_filter(noisy, 2)
```
绝大多数局部线性各向同性过滤器模糊图像 (`ndimage.uniform_filter`)
**中位数过滤器**更好的保留的边缘:
In [35]:
```
med_denoised = ndimage.median_filter(noisy, 3)
```

[[Python source code]](http://www.scipy-lectures.org/advanced/image_processing/auto_examples/plot_face_denoise.html#example-plot-face-denoise-py)
中位数过滤器: 对直边缘的结果更好 (低曲度):
In [37]:
```
im = np.zeros((20, 20))
im[5:-5, 5:-5] = 1
im = ndimage.distance_transform_bf(im)
im_noise = im + 0.2 * np.random.randn(*im.shape)
im_med = ndimage.median_filter(im_noise, 3)
```

[[Python source code]](http://www.scipy-lectures.org/advanced/image_processing/auto_examples/plot_denoising.html)
其他排名过滤器:`ndimage.maximum_filter`、`ndimage.percentile_filter`
其他的局部非线性过滤器: Wiener (`scipy.signal.wiener`) 等等.
**非局部过滤器**
**练习: 降噪**
* 创建一个带有一些对象 (圆形、椭圆、正方形或随机形状) 的二元图像 (0 和 1) .
* 添加一些噪音 (例如, 20% 的噪音)
* 用两种不同的降噪方法来降噪这个图像: 高斯过滤器和中位数过滤器。
* 比较两种不同降噪方法的直方图。哪一个与原始图像(无噪音)的直方图最接近?
**也看一下:** 在`skimage.denoising`中有更多的的降噪过滤器可用,见教程[Scikit-image: 图像处理](http://www.scipy-lectures.org/packages/scikit-image/index.html#scikit-image).
### 2.6.4.4 数学形态学
看一下[wikipedia](https://en.wikipedia.org/wiki/Mathematical_morphology)上的数学形态学定义。
探索一个简单形状 (结构化的元素) 的图像,然后根据这个形状是如何局部适应或不适应这个图像来修改这个图像。
**结构化元素:**
In [38]:
```
el = ndimage.generate_binary_structure(2, 1)
el
```
Out[38]:
```
array([[False, True, False],
[ True, True, True],
[False, True, False]], dtype=bool)
```
In [39]:
```
el.astype(np.int)
```
Out[39]:
```
array([[0, 1, 0],
[1, 1, 1],
[0, 1, 0]])
```

**风化(Erosion)** = 最小值过滤器。用结构化元素所覆盖的最小值来替换像素的值。:
In [41]:
```
a = np.zeros((7,7), dtype=np.int)
a[1:6, 2:5] = 1
a
```
Out[41]:
```
array([[0, 0, 0, 0, 0, 0, 0],
[0, 0, 1, 1, 1, 0, 0],
[0, 0, 1, 1, 1, 0, 0],
[0, 0, 1, 1, 1, 0, 0],
[0, 0, 1, 1, 1, 0, 0],
[0, 0, 1, 1, 1, 0, 0],
[0, 0, 0, 0, 0, 0, 0]])
```
In [42]:
```
ndimage.binary_erosion(a).astype(a.dtype)
```
Out[42]:
```
array([[0, 0, 0, 0, 0, 0, 0],
[0, 0, 0, 0, 0, 0, 0],
[0, 0, 0, 1, 0, 0, 0],
[0, 0, 0, 1, 0, 0, 0],
[0, 0, 0, 1, 0, 0, 0],
[0, 0, 0, 0, 0, 0, 0],
[0, 0, 0, 0, 0, 0, 0]])
```
In [43]:
```
#风化删除了比结构小的对象
ndimage.binary_erosion(a, structure=np.ones((5,5))).astype(a.dtype)
```
Out[43]:
```
array([[0, 0, 0, 0, 0, 0, 0],
[0, 0, 0, 0, 0, 0, 0],
[0, 0, 0, 0, 0, 0, 0],
[0, 0, 0, 0, 0, 0, 0],
[0, 0, 0, 0, 0, 0, 0],
[0, 0, 0, 0, 0, 0, 0],
[0, 0, 0, 0, 0, 0, 0]])
```

**扩大(Dilation)**:最大值过滤器:
In [44]:
```
a = np.zeros((5, 5))
a[2, 2] = 1
a
```
Out[44]:
```
array([[ 0., 0., 0., 0., 0.],
[ 0., 0., 0., 0., 0.],
[ 0., 0., 1., 0., 0.],
[ 0., 0., 0., 0., 0.],
[ 0., 0., 0., 0., 0.]])
```
In [45]:
```
ndimage.binary_dilation(a).astype(a.dtype)
```
Out[45]:
```
array([[ 0., 0., 0., 0., 0.],
[ 0., 0., 1., 0., 0.],
[ 0., 1., 1., 1., 0.],
[ 0., 0., 1., 0., 0.],
[ 0., 0., 0., 0., 0.]])
```
对于灰度值图像同样适用:
In [46]:
```
np.random.seed(2)
im = np.zeros((64, 64))
x, y = (63*np.random.random((2, 8))).astype(np.int)
im[x, y] = np.arange(8)
bigger_points = ndimage.grey_dilation(im, size=(5, 5), structure=np.ones((5, 5)))
square = np.zeros((16, 16))
square[4:-4, 4:-4] = 1
dist = ndimage.distance_transform_bf(square)
dilate_dist = ndimage.grey_dilation(dist, size=(3, 3), structure=np.ones((3, 3)))
```

[[Python source code]](http://www.scipy-lectures.org/advanced/image_processing/auto_examples/plot_greyscale_dilation.html)
**Opening**: erosion + dilation:
In [48]:
```
a = np.zeros((5,5), dtype=np.int)
a[1:4, 1:4] = 1; a[4, 4] = 1
a
```
Out[48]:
```
array([[0, 0, 0, 0, 0],
[0, 1, 1, 1, 0],
[0, 1, 1, 1, 0],
[0, 1, 1, 1, 0],
[0, 0, 0, 0, 1]])
```
In [49]:
```
# Opening 删除小对象
ndimage.binary_opening(a, structure=np.ones((3,3))).astype(np.int)
```
Out[49]:
```
array([[0, 0, 0, 0, 0],
[0, 1, 1, 1, 0],
[0, 1, 1, 1, 0],
[0, 1, 1, 1, 0],
[0, 0, 0, 0, 0]])
```
In [50]:
```
# Opening 也可以光滑转角
ndimage.binary_opening(a).astype(np.int)
```
Out[50]:
```
array([[0, 0, 0, 0, 0],
[0, 0, 1, 0, 0],
[0, 1, 1, 1, 0],
[0, 0, 1, 0, 0],
[0, 0, 0, 0, 0]])
```
**应用**: 去除噪音:
In [51]:
```
square = np.zeros((32, 32))
square[10:-10, 10:-10] = 1
np.random.seed(2)
x, y = (32*np.random.random((2, 20))).astype(np.int)
square[x, y] = 1
open_square = ndimage.binary_opening(square)
eroded_square = ndimage.binary_erosion(square)
reconstruction = ndimage.binary_propagation(eroded_square, mask=square)
```

[[Python source code]](http://www.scipy-lectures.org/advanced/image_processing/auto_examples/plot_propagation.html)
**Closing**: dilation + erosion 许多其他的数学形态学操作: hit 和 miss 转换、tophat等等。
### 2.6.5.2 分割
* 直方图分割 (没有空间信息)
In [52]:
```
n = 10
l = 256
im = np.zeros((l, l))
np.random.seed(1)
points = l*np.random.random((2, n**2))
im[(points[0]).astype(np.int), (points[1]).astype(np.int)] = 1
im = ndimage.gaussian_filter(im, sigma=l/(4.*n))
mask = (im > im.mean()).astype(np.float)
mask += 0.1 * im
img = mask + 0.2*np.random.randn(*mask.shape)
hist, bin_edges = np.histogram(img, bins=60)
bin_centers = 0.5*(bin_edges[:-1] + bin_edges[1:])
binary_img = img > 0.5
```
 [[Python source code]](http://www.scipy-lectures.org/advanced/image_processing/auto_examples/plot_histo_segmentation.html)
用数学形态学来清理结果:
In [53]:
```
# 删除小白色区域
open_img = ndimage.binary_opening(binary_img)
# 删除小黑洞
close_img = ndimage.binary_closing(open_img)
```
 [[Python source code]](http://www.scipy-lectures.org/advanced/image_processing/auto_examples/plot_clean_morpho.html)
**练习**
检查重建操作 (erosion + propagation) 生成一个比opening/closing更好的结果:
In [55]:
```
eroded_img = ndimage.binary_erosion(binary_img)
reconstruct_img = ndimage.binary_propagation(eroded_img, mask=binary_img)
tmp = np.logical_not(reconstruct_img)
eroded_tmp = ndimage.binary_erosion(tmp)
reconstruct_final = np.logical_not(ndimage.binary_propagation(eroded_tmp, mask=tmp))
np.abs(mask - close_img).mean()
```
Out[55]:
```
0.0072783654884356133
```
In [56]:
```
np.abs(mask - reconstruct_final).mean()
```
Out[56]:
```
0.00059502552803868841
```
**练习**
检查第一步降噪 (例如,中位数过滤器) 如何影响直方图,检查产生的基于直方图的分割是否更加准确。
**也可以看一下**:更高级分割算法可以在`scikit-image`中找到: 见[Scikit-image: 图像处理](http://www.scipy-lectures.org/packages/scikit-image/index.html#scikit-image)。
**也可以看一下**:其他科学计算包为图像处理提供的算法。在这个例子中,我们使用`scikit-learn`中的谱聚类函数以便分割黏在一起的对象。
In [57]:
```
from sklearn.feature_extraction import image
from sklearn.cluster import spectral_clustering
l = 100
x, y = np.indices((l, l))
center1 = (28, 24)
center2 = (40, 50)
center3 = (67, 58)
center4 = (24, 70)
radius1, radius2, radius3, radius4 = 16, 14, 15, 14
circle1 = (x - center1[0])**2 + (y - center1[1])**2 < radius1**2
circle2 = (x - center2[0])**2 + (y - center2[1])**2 < radius2**2
circle3 = (x - center3[0])**2 + (y - center3[1])**2 < radius3**2
circle4 = (x - center4[0])**2 + (y - center4[1])**2 < radius4**2
# 4个圆形
img = circle1 + circle2 + circle3 + circle4
mask = img.astype(bool)
img = img.astype(float)
img += 1 + 0.2*np.random.randn(*img.shape)
# 将图像转化为边缘带有坡度值的图。
graph = image.img_to_graph(img, mask=mask)
# 用一个梯度递减函数: 我们用它轻度依赖于接近voronoi的梯度细分
graph.data = np.exp(-graph.data/graph.data.std())
labels = spectral_clustering(graph, n_clusters=4, eigen_solver='arpack')
label_im = -np.ones(mask.shape)
label_im[mask] = labels
```

## 2.6.6 测量对象属性: `ndimage.measurements`
合成数据:
In [59]:
```
n = 10
l = 256
im = np.zeros((l, l))
points = l*np.random.random((2, n**2))
im[(points[0]).astype(np.int), (points[1]).astype(np.int)] = 1
im = ndimage.gaussian_filter(im, sigma=l/(4.*n))
mask = im > im.mean()
```
* 联通分支分析
标记联通分支:`ndimage.label`:
In [60]:
```
label_im, nb_labels = ndimage.label(mask)
nb_labels # 多少区域?
plt.imshow(label_im)
```
Out[60]:
```
<matplotlib.image.AxesImage at 0x11543ab10>
```
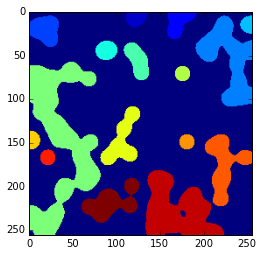

[[Python source code]](http://www.scipy-lectures.org/advanced/image_processing/auto_examples/plot_synthetic_data.html#example-plot-synthetic-data-py)
计算每个区域的大小、mean_value等等:
In [61]:
```
sizes = ndimage.sum(mask, label_im, range(nb_labels + 1))
mean_vals = ndimage.sum(im, label_im, range(1, nb_labels + 1))
```
清理小的联通分支:
In [62]:
```
mask_size = sizes < 1000
remove_pixel = mask_size[label_im]
remove_pixel.shape
label_im[remove_pixel] = 0
plt.imshow(label_im)
```
Out[62]:
```
<matplotlib.image.AxesImage at 0x114644a90>
```
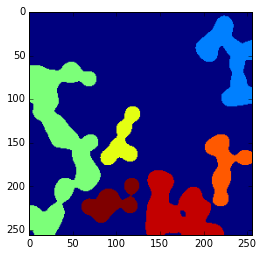
现在用`np.searchsorted`重新分配标签:
In [63]:
```
labels = np.unique(label_im)
label_im = np.searchsorted(labels, label_im)
```

[[Python source code]](http://www.scipy-lectures.org/advanced/image_processing/auto_examples/plot_measure_data.html)
找到包含感兴趣对象的区域:
In [65]:
```
slice_x, slice_y = ndimage.find_objects(label_im==4)[0]
roi = im[slice_x, slice_y]
plt.imshow(roi)
```
Out[65]:
```
<matplotlib.image.AxesImage at 0x1147fa8d0>
```
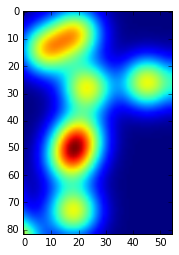
[[Python source code]](http://www.scipy-lectures.org/advanced/image_processing/auto_examples/plot_find_object.html)
其他空间测量: `ndimage.center_of_mass`, `ndimage.maximum_position`, 等等,可以在分割应用这个有限的部分之外使用。
实例: 块平均数:
In [66]:
```
from scipy import misc
f = misc.face(gray=True)
sx, sy = f.shape
X, Y = np.ogrid[0:sx, 0:sy]
regions = (sy//6) * (X//4) + (Y//6) # 注意我们使用广播
block_mean = ndimage.mean(f, labels=regions, index=np.arange(1, regions.max() +1))
block_mean.shape = (sx // 4, sy // 6)
```

[[Python source code]](http://www.scipy-lectures.org/advanced/image_processing/auto_examples/plot_block_mean.html)
当区域是标准的块时,使用步长刻度更加高效 (实例: [使用刻度的虚假维度](http://www.scipy-lectures.org/advanced/advanced_numpy/index.html#stride-manipulation-label))。
非标准空间块: radial平均:
In [67]:
```
sx, sy = f.shape
X, Y = np.ogrid[0:sx, 0:sy]
r = np.hypot(X - sx/2, Y - sy/2)
rbin = (20* r/r.max()).astype(np.int)
radial_mean = ndimage.mean(f, labels=rbin, index=np.arange(1, rbin.max() +1))
```

[[Python source code]](http://www.scipy-lectures.org/advanced/image_processing/auto_examples/plot_radial_mean.html)
* 其他测量
相关函数、Fourier/wavelet频谱、等㩐。
使用数学形态学的一个实例: [granulometry](https://en.wikipedia.org/wiki/Granulometry_%28morphology%29)
In [69]:
```
def disk_structure(n):
struct = np.zeros((2 * n + 1, 2 * n + 1))
x, y = np.indices((2 * n + 1, 2 * n + 1))
mask = (x - n)**2 + (y - n)**2 <= n**2
struct[mask] = 1
return struct.astype(np.bool)
def granulometry(data, sizes=None):
s = max(data.shape)
if sizes == None:
sizes = range(1, s/2, 2)
granulo = [ndimage.binary_opening(data, \
structure=disk_structure(n)).sum() for n in sizes]
return granulo
np.random.seed(1)
n = 10
l = 256
im = np.zeros((l, l))
points = l*np.random.random((2, n**2))
im[(points[0]).astype(np.int), (points[1]).astype(np.int)] = 1
im = ndimage.gaussian_filter(im, sigma=l/(4.*n))
mask = im > im.mean()
granulo = granulometry(mask, sizes=np.arange(2, 19, 4))
```
```
/Library/Frameworks/Python.framework/Versions/2.7/lib/python2.7/site-packages/ipykernel/__main__.py:11: FutureWarning: comparison to `None` will result in an elementwise object comparison in the future.
```

[[Python source code]](http://www.scipy-lectures.org/advanced/image_processing/auto_examples/plot_granulo.html)
**也看一下:** 关于图像处理的更多内容:
* 关于[Scikit-image](http://www.scipy-lectures.org/packages/scikit-image/index.html#scikit-image)的章节
* 其他更有力更完整的模块: [OpenCV](https://opencv-python-tutroals.readthedocs.org/en/latest) (Python绑定), [CellProfiler](http://www.cellprofiler.org/), [ITK](http://www.itk.org/) 带有Python绑定
2.5 SciPy中稀疏矩阵
最后更新于:2022-04-01 11:21:47
# 2.5 SciPy中稀疏矩阵
In [3]:
```
%matplotlib inline
import numpy as np
```
## 2.5.1 介绍
(密集) 矩阵是:
* 数据对象
* 存储二维值数组的数据结构
重要特征:
* 一次分配所有项目的内存
* 通常是一个连续组块,想一想Numpy数组
* _快速_访问个项目(*)
### 2.5.1.1 为什么有稀疏矩阵?
* 内存,增长是n**2
* 小例子(双精度矩阵):
In [5]:
```
import numpy as np
import matplotlib.pyplot as plt
x = np.linspace(0, 1e6, 10)
plt.plot(x, 8.0 * (x**2) / 1e6, lw=5)
plt.xlabel('size n')
plt.ylabel('memory [MB]')
```
Out[5]:
```
<matplotlib.text.Text at 0x105b08dd0>
```

### 2.5.1.2 稀疏矩阵 vs. 稀疏矩阵存储方案
* 稀疏矩阵是一个矩阵,巨大多数是空的
* 存储所有的0是浪费 -> 只存储非0项目
* 想一下**压缩**
* 有利: 巨大的内存节省
* 不利: 依赖实际的存储方案, (*) 通常并不能满足
### 2.5.1.3 典型应用
* 偏微分方程(PDES)的解
* 有限元素法
* 机械工程、电子、物理...
* 图论
* (i,j)不是0表示节点i与节点j是联接的
* ...
### 2.5.1.4 先决条件
最新版本的
* `numpy`
* `scipy`
* `matplotlib` (可选)
* `ipython` (那些增强很方便)
### 2.5.1.5 稀疏结构可视化
* matplotlib中的`spy()`
* 样例绘图:
 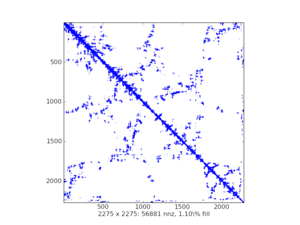 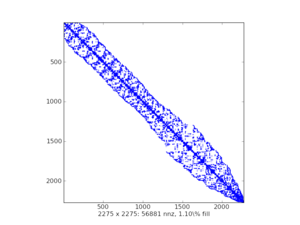
## 2.5.2 存储机制
* scipy.sparse中有七类稀疏矩阵:
1. csc_matrix: 压缩列格式
2. csr_matrix: 压缩行格式
3. bsr_matrix: 块压缩行格式
4. lil_matrix: 列表的列表格式
5. dok_matrix: 值的字典格式
6. coo_matrix: 座标格式 (即 IJV, 三维格式)
7. dia_matrix: 对角线格式
* 每一个类型适用于一些任务
* 许多都利用了由Nathan Bell提供的稀疏工具 C ++ 模块
* 假设导入了下列模块:
In [1]:
```
import numpy as np
import scipy.sparse as sparse
import matplotlib.pyplot as plt
```
* 给Numpy用户的**warning**:
* 使用'*'的乘是_矩阵相乘_ (点积)
* 并不是Numpy的一部分!
* 向Numpy函数传递一个稀疏矩阵希望一个ndarray/矩阵是没用的
### 2.5.2.1 通用方法
* 所有scipy.sparse类都是spmatrix的子类
* 算术操作的默认实现
* 通常转化为CSR
* 为了效率而子类覆盖
* 形状、数据类型设置/获取
* 非0索引
* 格式转化、与Numpy交互(toarray(), todense())
* ...
* 属性:
* mtx.A - 与mtx.toarray()相同
* mtx.T - 转置 (与mtx.transpose()相同)
* mtx.H - Hermitian (列举) 转置
* mtx.real - 复矩阵的真部
* mtx.imag - 复矩阵的虚部
* mtx.size - 非零数 (与self.getnnz()相同)
* mtx.shape - 行数和列数 (元组)
* 数据通常储存在Numpy数组中
### 2.5.2.2 稀疏矩阵类
#### 2.5.2.2.1 对角线格式 (DIA))
* 非常简单的格式
* 形状 (n_diag, length) 的密集Numpy数组的对角线
* 固定长度 -> 当离主对角线比较远时会浪费空间
* _data_matrix的子类 (带数据属性的稀疏矩阵类)
* 每个对角线的偏移
* 0 是主对角线
* 负偏移 = 下面
* 正偏移 = 上面
* 快速矩阵 * 向量 (sparsetools)
* 快速方便的关于项目的操作
* 直接操作数据数组 (快速的NumPy机件)
* 构建器接受 :
* 密集矩阵 (数组)
* 稀疏矩阵
* 形状元组 (创建空矩阵)
* (数据, 偏移) 元组
* 没有切片、没有单个项目访问
* 用法 :
* 非常专业
* 通过有限微分解偏微分方程
* 有一个迭代求解器 ##### 2.5.2.2.1.1 示例
* 创建一些DIA矩阵 :
In [3]:
```
data = np.array([[1, 2, 3, 4]]).repeat(3, axis=0)
data
```
Out[3]:
```
array([[1, 2, 3, 4],
[1, 2, 3, 4],
[1, 2, 3, 4]])
```
In [6]:
```
offsets = np.array([0, -1, 2])
mtx = sparse.dia_matrix((data, offsets), shape=(4, 4))
mtx
```
Out[6]:
```
<4x4 sparse matrix of type '<type 'numpy.int64'>'
with 9 stored elements (3 diagonals) in DIAgonal format>
```
In [7]:
```
mtx.todense()
```
Out[7]:
```
matrix([[1, 0, 3, 0],
[1, 2, 0, 4],
[0, 2, 3, 0],
[0, 0, 3, 4]])
```
In [9]:
```
data = np.arange(12).reshape((3, 4)) + 1
data
```
Out[9]:
```
array([[ 1, 2, 3, 4],
[ 5, 6, 7, 8],
[ 9, 10, 11, 12]])
```
In [10]:
```
mtx = sparse.dia_matrix((data, offsets), shape=(4, 4))
mtx.data
```
Out[10]:
```
array([[ 1, 2, 3, 4],
[ 5, 6, 7, 8],
[ 9, 10, 11, 12]])
```
In [11]:
```
mtx.offsets
```
Out[11]:
```
array([ 0, -1, 2], dtype=int32)
```
In [12]:
```
print mtx
```
```
(0, 0) 1
(1, 1) 2
(2, 2) 3
(3, 3) 4
(1, 0) 5
(2, 1) 6
(3, 2) 7
(0, 2) 11
(1, 3) 12
```
In [13]:
```
mtx.todense()
```
Out[13]:
```
matrix([[ 1, 0, 11, 0],
[ 5, 2, 0, 12],
[ 0, 6, 3, 0],
[ 0, 0, 7, 4]])
```
* 机制的解释 :
偏移: 行
```
2: 9
1: --10------
0: 1 . 11 .
-1: 5 2 . 12
-2: . 6 3 .
-3: . . 7 4
---------8
```
* 矩阵-向量相乘
In [15]:
```
vec = np.ones((4, ))
vec
```
Out[15]:
```
array([ 1., 1., 1., 1.])
```
In [16]:
```
mtx * vec
```
Out[16]:
```
array([ 12., 19., 9., 11.])
```
In [17]:
```
mtx.toarray() * vec
```
Out[17]:
```
array([[ 1., 0., 11., 0.],
[ 5., 2., 0., 12.],
[ 0., 6., 3., 0.],
[ 0., 0., 7., 4.]])
```
#### 2.5.2.2.2 列表的列表格式 (LIL))
* 基于行的联接列表
* 每一行是一个Python列表(排序的)非零元素的列索引
* 行存储在Numpy数组中 (dtype=np.object)
* 非零值也近似存储
* 高效增量构建稀疏矩阵
* 构建器接受 :
* 密集矩阵 (数组)
* 稀疏矩阵
* 形状元组 (创建一个空矩阵)
* 灵活切片、高效改变稀疏结构
* 由于是基于行的,算术和行切片慢
* 用途 :
* 当稀疏模式并不是已知的逻辑或改变
* 例子:从一个文本文件读取稀疏矩阵 ##### 2.5.2.2.2.1 示例
* 创建一个空的LIL矩阵 :
In [2]:
```
mtx = sparse.lil_matrix((4, 5))
```
* 准备随机数据:
In [4]:
```
from numpy.random import rand
data = np.round(rand(2, 3))
data
```
Out[4]:
```
array([[ 0., 0., 0.],
[ 1., 0., 0.]])
```
* 使用象征所以分配数据:
In [6]:
```
mtx[:2, [1, 2, 3]] = data
mtx
```
Out[6]:
```
<4x5 sparse matrix of type '<type 'numpy.float64'>'
with 3 stored elements in LInked List format>
```
In [7]:
```
print mtx
```
```
(0, 1) 1.0
(0, 3) 1.0
(1, 2) 1.0
```
In [8]:
```
mtx.todense()
```
Out[8]:
```
matrix([[ 0., 1., 0., 1., 0.],
[ 0., 0., 1., 0., 0.],
[ 0., 0., 0., 0., 0.],
[ 0., 0., 0., 0., 0.]])
```
In [9]:
```
mtx.toarray()
```
Out[9]:
```
array([[ 0., 1., 0., 1., 0.],
[ 0., 0., 1., 0., 0.],
[ 0., 0., 0., 0., 0.],
[ 0., 0., 0., 0., 0.]])
```
更多的切片和索引:
In [10]:
```
mtx = sparse.lil_matrix([[0, 1, 2, 0], [3, 0, 1, 0], [1, 0, 0, 1]])
mtx.todense()
```
Out[10]:
```
matrix([[0, 1, 2, 0],
[3, 0, 1, 0],
[1, 0, 0, 1]])
```
In [11]:
```
print mtx
```
```
(0, 1) 1
(0, 2) 2
(1, 0) 3
(1, 2) 1
(2, 0) 1
(2, 3) 1
```
In [12]:
```
mtx[:2, :]
```
Out[12]:
```
<2x4 sparse matrix of type '<type 'numpy.int64'>'
with 4 stored elements in LInked List format>
```
In [13]:
```
mtx[:2, :].todense()
```
Out[13]:
```
matrix([[0, 1, 2, 0],
[3, 0, 1, 0]])
```
In [14]:
```
mtx[1:2, [0,2]].todense()
```
Out[14]:
```
matrix([[3, 1]])
```
In [15]:
```
mtx.todense()
```
Out[15]:
```
matrix([[0, 1, 2, 0],
[3, 0, 1, 0],
[1, 0, 0, 1]])
```
#### 2.5.2.2.3 值的字典格式 (DOK))
* Python字典的子类
* 键是 (行, 列) 索引元组 (不允许重复的条目)
* 值是对应的非零值
* 高效增量构建稀疏矩阵
* 构建器支持:
* 密集矩阵 (数组)
* 稀疏矩阵
* 形状元组 (创建空矩阵)
* 高效 O(1) 对单个元素的访问
* 灵活索引,改变稀疏结构是高效
* 一旦创建完成后可以被高效转换为coo_matrix
* 算术很慢 (循环用`dict.iteritems()`)
* 用法:
* 当稀疏模式是未知的假设或改变时
##### 2.5.2.2.3.1 示例
* 逐个元素创建一个DOK矩阵:
In [16]:
```
mtx = sparse.dok_matrix((5, 5), dtype=np.float64)
mtx
```
Out[16]:
```
<5x5 sparse matrix of type '<type 'numpy.float64'>'
with 0 stored elements in Dictionary Of Keys format>
```
In [17]:
```
for ir in range(5):
for ic in range(5):
mtx[ir, ic] = 1.0 * (ir != ic)
mtx
```
Out[17]:
```
<5x5 sparse matrix of type '<type 'numpy.float64'>'
with 20 stored elements in Dictionary Of Keys format>
```
In [18]:
```
mtx.todense()
```
Out[18]:
```
matrix([[ 0., 1., 1., 1., 1.],
[ 1., 0., 1., 1., 1.],
[ 1., 1., 0., 1., 1.],
[ 1., 1., 1., 0., 1.],
[ 1., 1., 1., 1., 0.]])
```
* 切片与索引:
In [19]:
```
mtx[1, 1]
```
Out[19]:
```
0.0
```
In [20]:
```
mtx[1, 1:3]
```
Out[20]:
```
<1x2 sparse matrix of type '<type 'numpy.float64'>'
with 1 stored elements in Dictionary Of Keys format>
```
In [21]:
```
mtx[1, 1:3].todense()
```
Out[21]:
```
matrix([[ 0., 1.]])
```
In [22]:
```
mtx[[2,1], 1:3].todense()
```
Out[22]:
```
matrix([[ 1., 0.],
[ 0., 1.]])
```
#### 2.5.2.2.4 座标格式 (COO))
* 也被称为 ‘ijv’ 或 ‘triplet’ 格式
* 三个NumPy数组: row, col, data
* `data[i]`是在 (row[i], col[i]) 位置的值
* 允许重复值
* `\_data\_matrix`的子类 (带有`data`属性的稀疏矩阵类)
* 构建稀疏矩阵的高速模式
* 构建器接受:
* 密集矩阵 (数组)
* 稀疏矩阵
* 形状元组 (创建空数组)
* `(data, ij)`元组
* 与CSR/CSC格式非常快的互相转换
* 快速的矩阵 * 向量 (sparsetools)
* 快速而简便的逐项操作
* 直接操作数据数组 (快速NumPy机制)
* 没有切片,没有算术 (直接)
* 使用:
* 在各种稀疏格式间的灵活转换
* 当转化到其他形式 (通常是 CSR 或 CSC), 重复的条目被加总到一起
* 有限元素矩阵的快速高效创建
##### 2.5.2.2.4.1 示例
* 创建空的COO矩阵:
In [23]:
```
mtx = sparse.coo_matrix((3, 4), dtype=np.int8)
mtx.todense()
```
Out[23]:
```
matrix([[0, 0, 0, 0],
[0, 0, 0, 0],
[0, 0, 0, 0]], dtype=int8)
```
* 用 (data, ij) 元组创建:
In [24]:
```
row = np.array([0, 3, 1, 0])
col = np.array([0, 3, 1, 2])
data = np.array([4, 5, 7, 9])
mtx = sparse.coo_matrix((data, (row, col)), shape=(4, 4))
mtx
```
Out[24]:
```
<4x4 sparse matrix of type '<type 'numpy.int64'>'
with 4 stored elements in COOrdinate format>
```
In [25]:
```
mtx.todense()
```
Out[25]:
```
matrix([[4, 0, 9, 0],
[0, 7, 0, 0],
[0, 0, 0, 0],
[0, 0, 0, 5]])
```
#### 2.5.2.2.5 压缩稀疏行格式 (CSR))
* 面向行
* 三个Numpy数组: `indices`, `indptr`, `data`
* `indices`是列索引的数组
* `data`是对应的非零值数组
* `indptr`指向行开始的所以和数据
* 长度是`n_row + 1`, 最后一个项目 = 值数量 = `indices`和`data`的长度
* i-th行的非零值是列索引为`indices[indptr[i]:indptr[i+1]]`的`data[indptr[i]:indptr[i+1]]`
* 项目 (i, j) 可以通过`data[indptr[i]+k]`, k是j在`indices[indptr[i]:indptr[i+1]]`的位置来访问
* `_cs_matrix` (常规 CSR/CSC 功能) 的子类
* `_data_matrix` (带有`data`属性的稀疏矩阵类) 的子类
* 快速矩阵向量相乘和其他算术 (sparsetools)
* 构建器接受:
* 密集矩阵 (数组)
* 稀疏矩阵
* 形状元组 (创建空矩阵)
* `(data, ij)` 元组
* `(data, indices, indptr)` 元组
* 高效行切片,面向行的操作
* 较慢的列切片,改变稀疏结构代价昂贵
* 用途:
* 实际计算 (大多数线性求解器都支持这个格式)
##### 2.5.2.2.5.1 示例
* 创建空的CSR矩阵:
In [26]:
```
mtx = sparse.csr_matrix((3, 4), dtype=np.int8)
mtx.todense()
```
Out[26]:
```
matrix([[0, 0, 0, 0],
[0, 0, 0, 0],
[0, 0, 0, 0]], dtype=int8)
```
* 用`(data, ij)`元组创建:
In [27]:
```
row = np.array([0, 0, 1, 2, 2, 2])
col = np.array([0, 2, 2, 0, 1, 2])
data = np.array([1, 2, 3, 4, 5, 6])
mtx = sparse.csr_matrix((data, (row, col)), shape=(3, 3))
mtx
```
Out[27]:
```
<3x3 sparse matrix of type '<type 'numpy.int64'>'
with 6 stored elements in Compressed Sparse Row format>
```
In [28]:
```
mtx.todense()
```
Out[28]:
```
matrix([[1, 0, 2],
[0, 0, 3],
[4, 5, 6]])
```
In [29]:
```
mtx.data
```
Out[29]:
```
array([1, 2, 3, 4, 5, 6])
```
In [30]:
```
mtx.indices
```
Out[30]:
```
array([0, 2, 2, 0, 1, 2], dtype=int32)
```
In [31]:
```
mtx.indptr
```
Out[31]:
```
array([0, 2, 3, 6], dtype=int32)
```
用`(data, indices, indptr)`元组创建:
In [32]:
```
data = np.array([1, 2, 3, 4, 5, 6])
indices = np.array([0, 2, 2, 0, 1, 2])
indptr = np.array([0, 2, 3, 6])
mtx = sparse.csr_matrix((data, indices, indptr), shape=(3, 3))
mtx.todense()
```
Out[32]:
```
matrix([[1, 0, 2],
[0, 0, 3],
[4, 5, 6]])
```
#### 2.5.2.2.6 压缩稀疏列格式 (CSC))
* 面向列
* 三个Numpy数组: `indices`、`indptr`、`data`
* `indices`是行索引的数组
* `data`是对应的非零值
* `indptr`指向`indices`和`data`开始的列
* 长度是`n_col + 1`, 最后一个条目 = 值数量 = `indices`和`data`的长度
* 第i列的非零值是行索引为`indices[indptr[i]:indptr[i+1]]`的`data[indptr[i]:indptr[i+1]]`
* 项目 (i, j) 可以作为`data[indptr[j]+k]`访问, k是i在`indices[indptr[j]:indptr[j+1]]`的位置
* `_cs_matrix`的子类 (通用的 CSR/CSC 功能性)
* `_data_matrix`的子类 (带有`data`属性的稀疏矩阵类)
* 快速的矩阵和向量相乘及其他数学 (sparsetools)
* 构建器接受:
* 密集矩阵 (数组)
* 稀疏矩阵
* 形状元组 (创建空矩阵)
* `(data, ij)`元组
* `(data, indices, indptr)`元组
* 高效列切片、面向列的操作
* 较慢的行切片、改变稀疏结构代价昂贵
* 用途:
* 实际计算 (巨大多数线性求解器支持这个格式)
##### 2.5.2.2.6.1 示例
* 创建空CSC矩阵:
In [33]:
```
mtx = sparse.csc_matrix((3, 4), dtype=np.int8)
mtx.todense()
```
Out[33]:
```
matrix([[0, 0, 0, 0],
[0, 0, 0, 0],
[0, 0, 0, 0]], dtype=int8)
```
* 用`(data, ij)`元组创建:
In [34]:
```
row = np.array([0, 0, 1, 2, 2, 2])
col = np.array([0, 2, 2, 0, 1, 2])
data = np.array([1, 2, 3, 4, 5, 6])
mtx = sparse.csc_matrix((data, (row, col)), shape=(3, 3))
mtx
```
Out[34]:
```
<3x3 sparse matrix of type '<type 'numpy.int64'>'
with 6 stored elements in Compressed Sparse Column format>
```
In [35]:
```
mtx.todense()
```
Out[35]:
```
matrix([[1, 0, 2],
[0, 0, 3],
[4, 5, 6]])
```
In [36]:
```
mtx.data
```
Out[36]:
```
array([1, 4, 5, 2, 3, 6])
```
In [37]:
```
mtx.indices
```
Out[37]:
```
array([0, 2, 2, 0, 1, 2], dtype=int32)
```
In [38]:
```
mtx.indptr
```
Out[38]:
```
array([0, 2, 3, 6], dtype=int32)
```
* 用`(data, indices, indptr)`元组创建:
In [39]:
```
data = np.array([1, 4, 5, 2, 3, 6])
indices = np.array([0, 2, 2, 0, 1, 2])
indptr = np.array([0, 2, 3, 6])
mtx = sparse.csc_matrix((data, indices, indptr), shape=(3, 3))
mtx.todense()
```
Out[39]:
```
matrix([[1, 0, 2],
[0, 0, 3],
[4, 5, 6]])
```
#### 2.5.2.2.7 块压缩行格式 (BSR))
* 本质上,CSR带有密集的固定形状的子矩阵而不是纯量的项目
* 块大小`(R, C)`必须可以整除矩阵的形状`(M, N)`
* 三个Numpy数组: `indices`、`indptr`、`data`
* `indices`是每个块列索引的数组
* `data`是形状为(nnz, R, C)对应的非零值
* ...
* `_cs_matrix`的子类 (通用的CSR/CSC功能性)
* `_data_matrix`的子类 (带有`data`属性的稀疏矩阵类)
* 快速矩阵向量相乘和其他的算术 (sparsetools)
* 构建器接受:
* 密集矩阵 (数组)
* 稀疏矩阵
* 形状元组 (创建空的矩阵)
* `(data, ij)`元组
* `(data, indices, indptr)`元组
* 许多对于带有密集子矩阵的稀疏矩阵算术操作比CSR更高效很多
* 用途:
* 类似CSR
* 有限元素向量值离散化 ##### 2.5.2.2.7.1 示例
* 创建空的`(1, 1)`块大小的(类似CSR...)的BSR矩阵:
In [40]:
```
mtx = sparse.bsr_matrix((3, 4), dtype=np.int8)
mtx
```
Out[40]:
```
<3x4 sparse matrix of type '<type 'numpy.int8'>'
with 0 stored elements (blocksize = 1x1) in Block Sparse Row format>
```
In [41]:
```
mtx.todense()
```
Out[41]:
```
matrix([[0, 0, 0, 0],
[0, 0, 0, 0],
[0, 0, 0, 0]], dtype=int8)
```
* 创建块大小`(3, 2)`的空BSR矩阵:
In [42]:
```
mtx = sparse.bsr_matrix((3, 4), blocksize=(3, 2), dtype=np.int8)
mtx
```
Out[42]:
```
<3x4 sparse matrix of type '<type 'numpy.int8'>'
with 0 stored elements (blocksize = 3x2) in Block Sparse Row format>
```
```
- 一个bug?
```
* 用`(1, 1)`块大小 (类似 CSR...)`(data, ij)`的元组创建:
In [43]:
```
row = np.array([0, 0, 1, 2, 2, 2])
col = np.array([0, 2, 2, 0, 1, 2])
data = np.array([1, 2, 3, 4, 5, 6])
mtx = sparse.bsr_matrix((data, (row, col)), shape=(3, 3))
mtx
```
Out[43]:
```
<3x3 sparse matrix of type '<type 'numpy.int64'>'
with 6 stored elements (blocksize = 1x1) in Block Sparse Row format>
```
In [44]:
```
mtx.todense()
```
Out[44]:
```
matrix([[1, 0, 2],
[0, 0, 3],
[4, 5, 6]])
```
In [45]:
```
mtx.indices
```
Out[45]:
```
array([0, 2, 2, 0, 1, 2], dtype=int32)
```
In [46]:
```
mtx.indptr
```
Out[46]:
```
array([0, 2, 3, 6], dtype=int32)
```
* 用`(2, 1)`块大小`(data, indices, indptr)`的元组创建:
In [47]:
```
indptr = np.array([0, 2, 3, 6])
indices = np.array([0, 2, 2, 0, 1, 2])
data = np.array([1, 2, 3, 4, 5, 6]).repeat(4).reshape(6, 2, 2)
mtx = sparse.bsr_matrix((data, indices, indptr), shape=(6, 6))
mtx.todense()
```
Out[47]:
```
matrix([[1, 1, 0, 0, 2, 2],
[1, 1, 0, 0, 2, 2],
[0, 0, 0, 0, 3, 3],
[0, 0, 0, 0, 3, 3],
[4, 4, 5, 5, 6, 6],
[4, 4, 5, 5, 6, 6]])
```
In [48]:
```
data
```
Out[48]:
```
array([[[1, 1],
[1, 1]],
[[2, 2],
[2, 2]],
[[3, 3],
[3, 3]],
[[4, 4],
[4, 4]],
[[5, 5],
[5, 5]],
[[6, 6],
[6, 6]]])
```
### 2.5.2.3 总结
存储机制的总结
| 格式 | 矩阵 \* 向量 | 提取项目 | 灵活提取 | 设置项目 | 灵活设置 | 求解器 | 备注 |
| --- | --- | --- | --- | --- | --- | --- | --- |
| DIA | sparsetools | . | . | . | . | 迭代 | 有数据数组,专门化 |
| LIL | 通过 CSR | 是 | 是 | 是 | 是 | 迭代 | 通过CSR的算术, 增量构建 |
| DOK | python | 是 | 只有一个轴 | 是 | 是 | 迭代 | `O(1)`条目访问, 增量构建 |
| COO | sparsetools | . | . | . | . | 迭代 | 有数据数组, 便利的快速转换 |
| CSR | sparsetools | 是 | 是 | 慢 | . | 任何 | 有数据数组, 快速以行为主的操作 |
| CSC | sparsetools | 是 | 是 | 慢 | . | 任何 | 有数据数组, 快速以列为主的操作 |
| BSR | sparsetools | . | . | . | . | 专门化 | 有数据数组,专门化 |
2.4 代码优化
最后更新于:2022-04-01 11:21:45
# 2.4 代码优化
**作者**:Gaël Varoquaux
**Donald Knuth**
"过早的优化是一切罪恶的根源"
本章处理用策略让Python代码跑得更快。
**先决条件**
* line_profiler
* gprof2dot
* 来自dot实用程序
**章节内容**
* 优化工作流
* 剖析Python代码
* Timeit
* Profiler
* Line-profiler
* Running `cProfile`
* Using `gprof2dot`
* 让代码更快
* 算法优化
* SVD的例子
* 写更快的数值代码
* 其他的链接
## 2.4.1 优化工作流
1. 让它工作起来:用简单清晰的方式来写代码。
2. 让它可靠的工作:写自动的测试案例,以便真正确保你的算法是正确的,并且如果你破坏它,测试会捕捉到。
3. 通过剖析简单的使用案例找到瓶颈,并且加速这些瓶颈,寻找更好的算法或实现方式来优化代码。记住在剖析现实例子时简单和代码的执行速度需要进行一个权衡。要有效的运行,最好让剖析工作持续10s左右。
## 2.4.2剖析Python代码
**无测量无优化!**
* **测量**: 剖析, 计时
* 你可能会惊讶:最快的代码并不是通常你想的样子
### 2.4.2.1 Timeit
在IPython中,使用timeit([http://docs.python.org/library/timeit.html)来计时基本的操作:](http://docs.python.org/library/timeit.html)来计时基本的操作:)
In [2]:
```
import numpy as np
a = np.arange(1000)
%timeit a ** 2
```
```
The slowest run took 60.37 times longer than the fastest. This could mean that an intermediate result is being cached
100000 loops, best of 3: 1.99 µs per loop
```
In [3]:
```
%timeit a ** 2.1
```
```
10000 loops, best of 3: 45.1 µs per loop
```
In [4]:
```
%timeit a * a
```
```
The slowest run took 12.79 times longer than the fastest. This could mean that an intermediate result is being cached
100000 loops, best of 3: 1.86 µs per loop
```
用这个信息来指导在不同策略间进行选择。
**笔记**:对于运行时间较长的单元,使用`%time`来代替`%timeit`; 它准确性较差但是更快。
### 2.4.2.2 Profiler
当你有个大型程序要剖析时比较有用,例如[下面这个程序](http://scipy-lectures.github.io/_downloads/demo.py):
In [ ]:
```
# For this example to run, you also need the 'ica.py' file
import numpy as np
from scipy import linalg
from ica import fastica
def test():
data = np.random.random((5000, 100))
u, s, v = linalg.svd(data)
pca = np.dot(u[:, :10].T, data)
results = fastica(pca.T, whiten=False)
if __name__ == '__main__':
test()
```
**笔记**:这种技术是两个非监督学习技术的组合,主成分分析(PCA)和独立成分分析([ICA](http://scipy-lectures.github.io/advanced/optimizing/index.html#id16))。PCA是一种降维技术,即一种用更少的维度解释数据中观察到的变异的算法。ICA是一种源信号分离技术,例如分离由多个传感器记录的多种信号。如果传感器比信号多,那么先进行PCA然后ICA会有帮助。更多的信息请见:[来自scikits-learn的FastICA例子](http://scikit-learn.org/stable/auto_examples/decomposition/plot_ica_blind_source_separation.html)。
要运行它,你也需要下载[ica模块](http://scipy-lectures.github.io/_downloads/ica.py)。在IPython我们计时这个脚本:
In [8]:
```
%run -t demo.py
```
```
IPython CPU timings (estimated):
User : 6.62 s.
System : 0.17 s.
Wall time: 3.72 s.
```
```
/Users/cloga/Documents/scipy-lecture-notes_cn/ica.py:65: RuntimeWarning: invalid value encountered in sqrt
W = (u * np.diag(1.0/np.sqrt(s)) * u.T) * W # W = (W * W.T) ^{-1/2} * W
/Users/cloga/Documents/scipy-lecture-notes_cn/ica.py:90: RuntimeWarning: invalid value encountered in absolute
lim = max(abs(abs(np.diag(np.dot(W1, W.T))) - 1))
```
并且剖析它:
```
%run -p demo.py
301 function calls in 3.746 seconds
Ordered by: internal time
ncalls tottime percall cumtime percall filename:lineno(function)
1 3.714 3.714 3.715 3.715 decomp_svd.py:15(svd)
1 0.019 0.019 3.745 3.745 demo.py:3(<module>)
1 0.007 0.007 0.007 0.007 {method 'random_sample' of 'mtrand.RandomState' objects}
14 0.003 0.000 0.003 0.000 {numpy.core._dotblas.dot}
1 0.001 0.001 0.001 0.001 function_base.py:550(asarray_chkfinite)
2 0.000 0.000 0.000 0.000 linalg.py:1116(eigh)
1 0.000 0.000 3.745 3.745 {execfile}
2 0.000 0.000 0.001 0.000 ica.py:58(_sym_decorrelation)
2 0.000 0.000 0.000 0.000 {method 'reduce' of 'numpy.ufunc' objects}
1 0.000 0.000 0.000 0.000 ica.py:195(gprime)
1 0.000 0.000 0.001 0.001 ica.py:69(_ica_par)
1 0.000 0.000 3.726 3.726 demo.py:9(test)
1 0.000 0.000 0.001 0.001 ica.py:97(fastica)
1 0.000 0.000 0.000 0.000 ica.py:192(g)
23 0.000 0.000 0.000 0.000 defmatrix.py:290(__array_finalize__)
4 0.000 0.000 0.000 0.000 twodim_base.py:242(diag)
1 0.000 0.000 3.746 3.746 interactiveshell.py:2616(safe_execfile)
10 0.000 0.000 0.000 0.000 {numpy.core.multiarray.array}
1 0.000 0.000 3.745 3.745 py3compat.py:279(execfile)
1 0.000 0.000 0.000 0.000 {method 'normal' of 'mtrand.RandomState' objects}
50 0.000 0.000 0.000 0.000 {isinstance}
10 0.000 0.000 0.000 0.000 defmatrix.py:66(asmatrix)
10 0.000 0.000 0.000 0.000 defmatrix.py:244(__new__)
9 0.000 0.000 0.000 0.000 numeric.py:394(asarray)
1 0.000 0.000 0.000 0.000 _methods.py:53(_mean)
1 0.000 0.000 0.000 0.000 {posix.getcwdu}
4 0.000 0.000 0.000 0.000 {method 'astype' of 'numpy.ndarray' objects}
6 0.000 0.000 0.000 0.000 defmatrix.py:338(__mul__)
2 0.000 0.000 0.000 0.000 linalg.py:139(_commonType)
4 0.000 0.000 0.000 0.000 {method 'view' of 'numpy.ndarray' objects}
1 0.000 0.000 0.000 0.000 posixpath.py:329(normpath)
5 0.000 0.000 0.000 0.000 {abs}
1 0.000 0.000 0.000 0.000 {open}
1 0.000 0.000 0.000 0.000 blas.py:172(find_best_blas_type)
1 0.000 0.000 0.000 0.000 blas.py:216(_get_funcs)
1 0.000 0.000 0.000 0.000 syspathcontext.py:64(__exit__)
3 0.000 0.000 0.000 0.000 {max}
6 0.000 0.000 0.000 0.000 {method 'transpose' of 'numpy.ndarray' objects}
1 0.000 0.000 0.000 0.000 posixpath.py:120(dirname)
2 0.000 0.000 0.000 0.000 linalg.py:101(get_linalg_error_extobj)
2 0.000 0.000 0.000 0.000 linalg.py:106(_makearray)
3 0.000 0.000 0.000 0.000 {numpy.core.multiarray.zeros}
6 0.000 0.000 0.000 0.000 defmatrix.py:928(getT)
1 0.000 0.000 0.000 0.000 syspathcontext.py:57(__enter__)
2 0.000 0.000 0.000 0.000 linalg.py:209(_assertNdSquareness)
7 0.000 0.000 0.000 0.000 {issubclass}
4 0.000 0.000 0.000 0.000 {getattr}
1 0.000 0.000 0.000 0.000 posixpath.py:358(abspath)
5 0.000 0.000 0.000 0.000 {method 'startswith' of 'unicode' objects}
2 0.000 0.000 0.000 0.000 linalg.py:198(_assertRankAtLeast2)
2 0.000 0.000 0.000 0.000 {method 'encode' of 'unicode' objects}
10 0.000 0.000 0.000 0.000 {method 'get' of 'dict' objects}
1 0.000 0.000 0.000 0.000 _methods.py:43(_count_reduce_items)
1 0.000 0.000 0.000 0.000 {method 'all' of 'numpy.ndarray' objects}
4 0.000 0.000 0.000 0.000 linalg.py:124(_realType)
1 0.000 0.000 0.000 0.000 syspathcontext.py:54(__init__)
1 0.000 0.000 0.000 0.000 posixpath.py:61(join)
1 0.000 0.000 3.746 3.746 <string>:1(<module>)
1 0.000 0.000 0.000 0.000 _methods.py:40(_all)
4 0.000 0.000 0.000 0.000 linalg.py:111(isComplexType)
2 0.000 0.000 0.000 0.000 {method '__array_prepare__' of 'numpy.ndarray' objects}
4 0.000 0.000 0.000 0.000 {min}
1 0.000 0.000 0.000 0.000 py3compat.py:19(encode)
1 0.000 0.000 0.000 0.000 defmatrix.py:872(getA)
2 0.000 0.000 0.000 0.000 numerictypes.py:949(_can_coerce_all)
6 0.000 0.000 0.000 0.000 {method 'append' of 'list' objects}
1 0.000 0.000 0.000 0.000 numerictypes.py:970(find_common_type)
1 0.000 0.000 0.000 0.000 {method 'mean' of 'numpy.ndarray' objects}
11 0.000 0.000 0.000 0.000 {len}
1 0.000 0.000 0.000 0.000 numeric.py:464(asanyarray)
1 0.000 0.000 0.000 0.000 {method '__array__' of 'numpy.ndarray' objects}
1 0.000 0.000 0.000 0.000 {method 'rfind' of 'unicode' objects}
2 0.000 0.000 0.000 0.000 {method 'upper' of 'str' objects}
1 0.000 0.000 0.000 0.000 posixpath.py:251(expanduser)
3 0.000 0.000 0.000 0.000 {method 'setdefault' of 'dict' objects}
1 0.000 0.000 0.000 0.000 {method 'diagonal' of 'numpy.ndarray' objects}
1 0.000 0.000 0.000 0.000 lapack.py:239(get_lapack_funcs)
1 0.000 0.000 0.000 0.000 {method 'rstrip' of 'unicode' objects}
1 0.000 0.000 0.000 0.000 py3compat.py:29(cast_bytes)
1 0.000 0.000 0.000 0.000 posixpath.py:52(isabs)
1 0.000 0.000 0.000 0.000 {method 'split' of 'unicode' objects}
1 0.000 0.000 0.000 0.000 {method 'endswith' of 'unicode' objects}
1 0.000 0.000 0.000 0.000 {sys.getdefaultencoding}
1 0.000 0.000 0.000 0.000 {method 'insert' of 'list' objects}
1 0.000 0.000 0.000 0.000 {method 'remove' of 'list' objects}
1 0.000 0.000 0.000 0.000 {method 'join' of 'unicode' objects}
1 0.000 0.000 0.000 0.000 {method 'index' of 'list' objects}
1 0.000 0.000 0.000 0.000 misc.py:126(_datacopied)
1 0.000 0.000 0.000 0.000 {sys.getfilesystemencoding}
1 0.000 0.000 0.000 0.000 {method 'disable' of '_lsprof.Profiler' objects}
```
很明显`svd`(**decomp.py**中)占用了最多的时间,换句话说,是瓶颈。我们要找到方法让这个步骤跑的更快,或者避免这个步骤(算法优化)。在其他部分花费时间是没用的。
### 2.4.2.3 Line-profiler
profiler很棒:它告诉我们哪个函数花费了最多的时间,但是,不是它在哪里被调用。
关于这一点,我们使用[line_profiler](http://packages.python.org/line_profiler/):在源文件中,[[email protected]](/cdn-cgi/l/email-protection)(不需要导入它)修饰了一些想要用检查的函数:
In [ ]:
```
@profile
def test():
data = np.random.random((5000, 100))
u, s, v = linalg.svd(data)
pca = np.dot(u[: , :10], data)
results = fastica(pca.T, whiten=False)
```
接着我们用[kernprof.py](http://packages.python.org/line_profiler/kernprof.py)来运行这个脚本,开启`-l, --line-by-line`和`-v, --view`来使用逐行profiler,并且查看结果并保存他们:
```
kernprof.py -l -v demo.py
Wrote profile results to demo.py.lprof
Timer unit: 1e-06 s
File: demo.py
Function: test at line 5
Total time: 14.2793 s
Line # Hits Time Per Hit % Time Line Contents
==============================================================
5 @profile
6 def test():
7 1 19015 19015.0 0.1 data = np.random.random((5000, 100))
8 1 14242163 14242163.0 99.7 u, s, v = linalg.svd(data)
9 1 10282 10282.0 0.1 pca = np.dot(u[:10, :], data)
10 1 7799 7799.0 0.1 results = fastica(pca.T, whiten=False)
```
SVD占用了几乎所有时间,我们需要优化这一行。
### 2.4.2.4 运行`cProfile`
在上面的IPython例子中,Ipython只是调用了内置的[Python剖析器](http://docs.python.org/2/library/profile.html)`cProfile`和`profile`。如果你想要用一个可视化工具来处理剖析器的结果,这会有帮助。
```
python -m cProfile -o demo.prof demo.py
```
使用`-o`开关将输入剖析器结果到文件`demo.prof`。
### 2.4.2.5 使用`gprof2dot`
如果你想要更加视觉化的剖析器输入结果,你可以使用[gprof2dot](http://code.google.com/p/jrfonseca/wiki/Gprof2Dot)工具:
In [ ]:
```
gprof2dot -f pstats demo.prof | dot -Tpng -o demo-prof.png
```
这会生成下面的图片:

这种方法打印了一个类似前一种方法的图片。
## 2.4.3 让代码更快
一旦我们识别出瓶颈,我们需要让相关的代码跑得更快。
### 2.4.3.1 算法优化
第一件要看的事情是算法优化:有没有计算量更小的方法或者更好的方法?
从更高的视角来看这个问题,对算法背后的数学有一个很好的理解会有帮助。但是,寻找到像**将计算或内存分配移到循环外**这样的简单改变,来带来巨大的收益,通常很困难。
#### 2.4.3.1.1 SVD的例子
在上面的两个例子中,SVD - [奇异值分解](http://en.wikipedia.org/wiki/Singular_value_decomposition) - 花费了最多的时间。确实,这个算法的计算成本大概是输入矩阵大小的$n^3$。
但是,在这些例子中,我们并不是使用SVD的所有输出,而只是它第一个返回参数的前几行。如果我们使用scipy的`svd`实现,我们可以请求一个这个SVD的不完整版本。注意scipy中的线性代数实现比在numpy中更丰富,应该被优选选用。
In [20]:
```
%timeit np.linalg.svd(data)
```
```
1 loops, best of 3: 4.12 s per loop
```
In [21]:
```
from scipy import linalg
%timeit linalg.svd(data)
```
```
1 loops, best of 3: 3.65 s per loop
```
In [22]:
```
%timeit linalg.svd(data, full_matrices=False)
```
```
10 loops, best of 3: 70.5 ms per loop
```
In [23]:
```
%timeit np.linalg.svd(data, full_matrices=False)
```
```
10 loops, best of 3: 70.3 ms per loop
```
接下来我们可以用这个发现来[优化前面的代码](http://scipy-lectures.github.io/_downloads/demo_opt.py):
In [24]:
```
import demo
```
In [27]:
```
%timeit demo.test()
```
```
1 loops, best of 3: 3.65 s per loop
```
In [28]:
```
import demo_opt
```
In [29]:
```
%timeit demo_opt.test()
```
```
10 loops, best of 3: 81.9 ms per loop
```
真实的非完整版SVD,即只计算前十个特征向量,可以用arpack来计算,可以在`scipy.sparse.linalg.eigsh`找到。
**计算线性代数**
对于特定的算法,许多瓶颈会是线性代数计算。在这种情况下,使用正确的方法来解决正确的问题是关键。例如一个对称矩阵中的特征向量问题比通用矩阵中更好解决。同样,更普遍的是,你可以避免矩阵逆转,使用一些成本更低(在数字上更可靠)的操作。
了解你的计算线性代数。当有疑问时,查找`scipy.linalg`,并且用`%timeit`来试一下替代方案。
## 2.4.4 写更快的数值代码
关于numpy的高级使用的讨论可以在[高级numpy](http://scipy-lectures.github.io/advanced/advanced_numpy/index.html#advanced-numpy)那章,或者由van der Walt等所写的文章[NumPy数组: 一种高效数值计算结构](http://hal.inria.fr/inria-00564007/en)。这里只是一些经常会遇到的让代码更快的小技巧。
* 循环向量化
找到一些技巧来用numpy数组避免循环。对于这一点,掩蔽和索引通常很有用。
* 广播
在数组合并前,在尽可能小的数组上使用广播。
* 原地操作
In [30]:
```
a = np.zeros(1e7)
%timeit global a ; a = 0*a
```
```
10 loops, best of 3: 33.5 ms per loop
```
```
/Library/Frameworks/Python.framework/Versions/2.7/lib/python2.7/site-packages/ipykernel/__main__.py:1: DeprecationWarning: using a non-integer number instead of an integer will result in an error in the future
if __name__ == '__main__':
```
In [31]:
```
%timeit global a ; a *= 0
```
```
100 loops, best of 3: 8.98 ms per loop
```
**注意**: 我们需要在timeit中`global a`,以便正常工作,因为,向a赋值,会被认为是一个本地变量。
* 对内存好一点:使用视图而不是副本
复制一个大数组和在上面进行简单的数值运算一样代价昂贵:
In [32]:
```
a = np.zeros(1e7)
```
```
/Library/Frameworks/Python.framework/Versions/2.7/lib/python2.7/site-packages/ipykernel/__main__.py:1: DeprecationWarning: using a non-integer number instead of an integer will result in an error in the future
if __name__ == '__main__':
```
In [33]:
```
%timeit a.copy()
```
```
10 loops, best of 3: 28.2 ms per loop
```
In [34]:
```
%timeit a + 1
```
```
10 loops, best of 3: 33.4 ms per loop
```
* 注意缓存作用
分组后内存访问代价很低:用连续的方式访问一个大数组比随机访问快很多。这意味着在其他方式中小步幅会更快(见[CPU缓存作用](http://scipy-lectures.github.io/advanced/advanced_numpy/index.html#cache-effects)):
In [35]:
```
c = np.zeros((1e4, 1e4), order='C')
```
```
/Library/Frameworks/Python.framework/Versions/2.7/lib/python2.7/site-packages/ipykernel/__main__.py:1: DeprecationWarning: using a non-integer number instead of an integer will result in an error in the future
if __name__ == '__main__':
```
In [36]:
```
%timeit c.sum(axis=0)
```
```
The slowest run took 5.66 times longer than the fastest. This could mean that an intermediate result is being cached
1 loops, best of 3: 80.9 ms per loop
```
In [37]:
```
%timeit c.sum(axis=1)
```
```
10 loops, best of 3: 79.7 ms per loop
```
In [38]:
```
c.strides
```
Out[38]:
```
(80000, 8)
```
这就是为什么Fortran顺序或者C顺序会在操作上有很大的不同:
In [39]:
```
a = np.random.rand(20, 2**18)
```
In [40]:
```
b = np.random.rand(20, 2**18)
```
In [41]:
```
%timeit np.dot(b, a.T)
```
```
10 loops, best of 3: 23.8 ms per loop
```
In [42]:
```
c = np.ascontiguousarray(a.T)
```
In [43]:
```
%timeit np.dot(b, c)
```
```
10 loops, best of 3: 22.2 ms per loop
```
注意,通过复制数据来绕过这个效果是不值得的:
In [44]:
```
%timeit c = np.ascontiguousarray(a.T)
```
```
10 loops, best of 3: 42.2 ms per loop
```
使用[numexpr](http://code.google.com/p/numexpr/)可以帮助自动优化代码的这种效果。
* 使用编译的代码
一旦你确定所有的高级优化都试过了,那么最后一招就是转移热点,即将最花费时间的几行或函数编译代码。要编译代码,优先选项是用使用[Cython](http://www.cython.org/):它可以简单的将Python代码转化为编译代码,并且很好的使用numpy支持来以numpy数据产出高效代码,例如通过展开循环。
**警告**:对于以上的技巧,剖析并计时你的选择。不要基于理论思考来优化。
### 2.4.4.1 其他的链接
* 如果你需要剖析内存使用,你要应该试试[memory_profiler](http://pypi.python.org/pypi/memory_profiler)
* 如果你需要剖析C扩展程序,你应该用[yep](http://pypi.python.org/pypi/yep)从Python中试着使用一下[gperftools](http://code.google.com/p/gperftools/?redir=1)。
* 如果你想要持续跟踪代码的效率,比如随着你不断向代码库提交,你应该试一下:[vbench](https://github.com/pydata/vbench)
* 如果你需要一些交互的可视化为什么不试一下[RunSnakeRun](http://www.vrplumber.com/programming/runsnakerun/)
2.3 代码除错
最后更新于:2022-04-01 11:21:42
# 2.3 代码除错
**作者**:Gaël Varoquaux
这篇教程探索了更好的理解代码基础、寻找并修复bug的工具。
这部分内容并不是特别针对于科学Python社区,但是我们将要采用的策略是专门针对科学计算量身定制的。
**先决条件**
* Numpy
* IPython
* nosetests ([http://readthedocs.org/docs/nose/en/latest/](http://readthedocs.org/docs/nose/en/latest/))
* pyflakes ([http://pypi.python.org/pypi/pyflakes](http://pypi.python.org/pypi/pyflakes))
* gdb对C-debugging部分。
**章节内容**
* 避免bugs
* 避免麻烦的最佳代码实践
* pyflakes:快速静态分析
* 在当前编辑的文件上运行pyflakes
* 随着打字进行的拼写检查器整合
* 查错工作流
* 使用Python除错器
* 激活除错器
* 事后剖析
* 逐步执行
* 启动除错器的其他方式
* 除错器命令与交互
* 在除错器中获得帮助
* 使用gdb排除代码段的错误
## 2.3.1 避免bugs
### 2.3.1.1 避免麻烦的最佳代码实践
**Brian Kernighan**
“每个人都知道除错比从零开始写一个程序难两倍。因此,如果当你写程序时足够聪明,为什么你不对它进行除错呢?”
* 我都会写出有错误的代码。接收这些代码。处理这些代码。
* 写代码时记得测试和除错。
* 保持简单和直接(KISS)。
* 能起作用的最简单的事是什么?
* 不要重复自身(DRY)。
* 每一个知识碎片都必须在系统中有一个清晰、权威的表征
* 变量、算法等等
* 试着限制代码的依赖。(松耦合)
* 给变量、函数和模块有意义的名字(而不是数学名字)
### 2.3.1.2 pyflakes:快速静态分析
在Python中有一些静态分析;举几个例子:
* [pylint](http://www.logilab.org/857)
* [pychecker](http://pychecker.sourceforge.net/)
* [pyflakes](http://pypi.python.org/pypi/pyflakes)
* [pep8](http://pypi.python.org/pypi/pep8)
* [flake8](http://pypi.python.org/pypi/flake8)
这里我们关注`pyflakes`,它是最简单的工具。
* **快速**、**简单**
* 识别语法错误、没有imports、名字打印打错。
另一个好的推荐是`flake8`工具,是pyflakes和pep8。因此,除了pyflakes捕捉错误类型外,flake8也可以察觉对[PEP8](http://www.python.org/dev/peps/pep-0008/)风格指南建议的违背。
强烈推荐在你的编辑器或IDE整合pyflakes (或 flake8),**确实可以产出生产力的收益**。
#### 2.3.1.2.1 在当前编辑文件上运行pyflakes
你可以在当前缓存器中绑定一个键来运行pyflakes。
* **在kate中**
* 菜单:设定 -> 配置 kate
* 在插件中启用“外部”
* 在外部工具,添加pyflakes:
In [ ]:
```
kdialog --title "pyflakes %filename" --msgbox "$(pyflakes %filename)"
```
* **在TextMate中**
* 菜单: TextMate -> 偏好 -> 高级 -> Shell变量,添加shell变量:
In [ ]:
```
TM_PYCHECKER=/Library/Frameworks/Python.framework/Versions/Current/bin/pyflakes
```
```
- 然后 Ctrl-Shift-V 被绑定到pyflakes报告
```
* **在vim中**
* 在你的vimrc中 (将F5绑定到pyflakes):
In [ ]:
```
autocmd FileType python let &mp = 'echo "*** running % ***" ; pyflakes %'
autocmd FileType tex,mp,rst,python imap <Esc>[15~ <C-O>:make!^M
autocmd FileType tex,mp,rst,python map <Esc>[15~ :make!^M
autocmd FileType tex,mp,rst,python set autowrite
```
* **在emacs中**
* 在你的emacs中 (将F5绑定到pyflakes):
In [ ]:
```
(defun pyflakes-thisfile () (interactive)
(compile (format "pyflakes %s" (buffer-file-name)))
)
(define-minor-mode pyflakes-mode
"Toggle pyflakes mode.
With no argument, this command toggles the mode.
Non-null prefix argument turns on the mode.
Null prefix argument turns off the mode."
;; The initial value.
nil
;; The indicator for the mode line.
" Pyflakes"
;; The minor mode bindings.
'( ([f5] . pyflakes-thisfile) )
)
(add-hook 'python-mode-hook (lambda () (pyflakes-mode t)))
```
#### 2.3.1.2.2 随着打字进行的拼写检查器整合
* **在vim中**
* 使用pyflakes.vim插件:
1. 从[http://www.vim.org/scripts/script.php?script_id=2441](http://www.vim.org/scripts/script.php?script_id=2441) 下载zip文件
2. 将文件提取到~/.vim/ftplugin/python
3. 确保你的vimrc的filetype插件的缩进是开启的 
* 或者: 使用syntastic插件。这个插件也可以设置为使用flake8,处理实时检查许多其他语言。 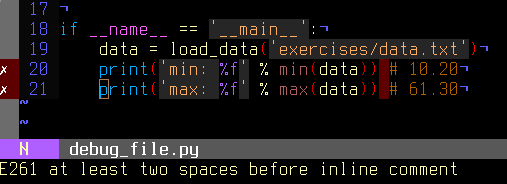
* **在emacs中**
* 使用flymake模式以及pyflakes, 文档在[http://www.plope.com/Members/chrism/flymake-mode](http://www.plope.com/Members/chrism/flymake-mode) : 在你的.emacs文件中添加下来代码:
In [ ]:
```
(when (load "flymake" t)
(defun flymake-pyflakes-init ()
(let* ((temp-file (flymake-init-create-temp-buffer-copy
'flymake-create-temp-inplace))
(local-file (file-relative-name
temp-file
(file-name-directory buffer-file-name))))
(list "pyflakes" (list local-file))))
(add-to-list 'flymake-allowed-file-name-masks
'("\\.py\\'" flymake-pyflakes-init)))
(add-hook 'find-file-hook 'flymake-find-file-hook)
```
## 2.3.2 除错工作流
如果你确实有一个非无关紧要的bug,这个时候就是除错策略该介入的时候。没有银子弹。但是,策略会有帮助:
```
对于给定问题的除错,最合适的情况是当问题被隔离在几行代码的时候,外面是框架或应用代码,有较短的修改-运行-失败循环。
```
1. 让它可以可靠的失败。找到一个测试案例,可以让代码每次都失败。
2. 分而治之。一旦你有一个测试案例,隔离错误的代码。
* 哪个模块。
* 哪个函数。
* 哪行代码。
=>隔离小的可重复错误:测试案例
3. 每次只改变一个事情并且重新运行失败的测试案例。
4. 使用除错器来理解哪里出错了。
5. 耐心的记笔记。可能会花一些时间。
**笔记**:一旦你遵从了这个流程:隔离一段可以重现bug的紧密代码段,并且用这段代码来修复bug,添加对应代码到你的测试套装。
## 2.3.3 使用Python除错器
python除错器,pdb: [http://docs.python.org/library/pdb.html](http://docs.python.org/library/pdb.html), 允许你交互的检查代码。
具体来说,它允许你:
* 查看源代码。
* 在调用栈上下游走。
* 检查变量值。
* 修改变量值。
* 设置断点。
**print** 是的,print语句确实可以作为除错工具。但是,要检查运行时间,使用除错器通常更加高效。
--
### 2.3.3.1 激活除错器
启动除错器的方式:
1. 事后剖析,在模块错误后启动除错器。
2. 用除错器启动模块。
3. 在模块中调用除错器。
#### 2.3.3.1.1 事后剖析
**情景**: 你在IPython中工作时,你的到了一个traceback。
这里我们除错文件[index_error.py](http://scipy-lectures.github.io/_downloads/index_error.py)。当运行它时,抛出`IndexError`。输入`%debug`进入除错器。
In [1]:
```
%run index_error.py
```
```
---------------------------------------------------------------------------
IndexError Traceback (most recent call last)
/Users/cloga/Documents/scipy-lecture-notes_cn/index_error.py in <module>()
6
7 if __name__ == '__main__':
----> 8 index_error()
9
/Users/cloga/Documents/scipy-lecture-notes_cn/index_error.py in index_error()
3 def index_error():
4 lst = list('foobar')
----> 5 print lst[len(lst)]
6
7 if __name__ == '__main__':
IndexError: list index out of range
```
In [2]:
```
%debug
```
```
> /Users/cloga/Documents/scipy-lecture-notes_cn/index_error.py(5)index_error()
4 lst = list('foobar')
----> 5 print lst[len(lst)]
6
ipdb> list
1 """Small snippet to raise an IndexError."""
2
3 def index_error():
4 lst = list('foobar')
----> 5 print lst[len(lst)]
6
7 if __name__ == '__main__':
8 index_error()
9
ipdb> len(lst)
6
ipdb> print lst[len(lst)-1]
r
ipdb> quit
```
**不用IPthon的事后剖析除错**
在一些情况下,你不可以使用IPython,例如除错一个想到从命令行调用的脚本。在这个情况下,你可以用`python -m pdb script.py`调用脚本:
```
$ python -m pdb index_error.py
> /home/varoquau/dev/scipy-lecture-notes/advanced/debugging_optimizing/index_error.py(1)<module>()
-> """Small snippet to raise an IndexError."""
(Pdb) continue
Traceback (most recent call last):
File "/usr/lib/python2.6/pdb.py", line 1296, in main
pdb._runscript(mainpyfile)
File "/usr/lib/python2.6/pdb.py", line 1215, in _runscript
self.run(statement)
File "/usr/lib/python2.6/bdb.py", line 372, in run
exec cmd in globals, locals
File "<string>", line 1, in <module>
File "index_error.py", line 8, in <module>
index_error()
File "index_error.py", line 5, in index_error
print lst[len(lst)]
IndexError: list index out of range
Uncaught exception. Entering post mortem debugging
Running 'cont' or 'step' will restart the program
> /home/varoquau/dev/scipy-lecture-notes/advanced/debugging_optimizing/index_error.py(5)index_error()
-> print lst[len(lst)]
(Pdb)
```
#### 2.3.3.1.2 逐步执行
**情景**:你相信模块中存在bug,但是你不知道在哪。
例如我们想要除错[wiener_filtering.py](http://scipy-lectures.github.io/_downloads/wiener_filtering.py)。代码确实可以运行,但是,过滤不起作用。
* 在IPython用`%run -d wiener_filtering.p`来运行这个脚本:
```
In [1]: %run -d wiener_filtering.py
*** Blank or comment
*** Blank or comment
*** Blank or comment
Breakpoint 1 at /home/varoquau/dev/scipy-lecture-notes/advanced/debugging_optimizing/wiener_filtering.py:4
NOTE: Enter 'c' at the ipdb> prompt to start your script.
> <string>(1)<module>()
```
* 用`b 34`在34行设置一个断点:
```
ipdb> n
> /home/varoquau/dev/scipy-lecture-notes/advanced/debugging_optimizing/wiener_filtering.py(4)<module>()
3
1---> 4 import numpy as np
5 import scipy as sp
ipdb> b 34
Breakpoint 2 at /home/varoquau/dev/scipy-lecture-notes/advanced/debugging_optimizing/wiener_filtering.py:34
```
* 用`c(ont(inue))`继续运行到下一个断点:
```
ipdb> c
> /home/varoquau/dev/scipy-lecture-notes/advanced/debugging_optimizing/wiener_filtering.py(34)iterated_wiener()
33 """
2--> 34 noisy_img = noisy_img
35 denoised_img = local_mean(noisy_img, size=size)
```
* 用`n(ext)`和`s(tep)`在代码中步进:`next`在当前运行的背景下跳跃到下一个语句,而`step`将跨过执行的背景,即可以检查内部函数调用:
```
ipdb> s
> /home/varoquau/dev/scipy-lecture-notes/advanced/debugging_optimizing/wiener_filtering.py(35)iterated_wiener()
2 34 noisy_img = noisy_img
---> 35 denoised_img = local_mean(noisy_img, size=size)
36 l_var = local_var(noisy_img, size=size)
ipdb> n
> /home/varoquau/dev/scipy-lecture-notes/advanced/debugging_optimizing/wiener_filtering.py(36)iterated_wiener()
35 denoised_img = local_mean(noisy_img, size=size)
---> 36 l_var = local_var(noisy_img, size=size)
37 for i in range(3):
```
* 跨过一些行,并且检查本地变量:
```
ipdb> n
> /home/varoquau/dev/scipy-lecture-notes/advanced/debugging_optimizing/wiener_filtering.py(37)iterated_wiener()
36 l_var = local_var(noisy_img, size=size)
---> 37 for i in range(3):
38 res = noisy_img - denoised_img
ipdb> print l_var
[[5868 5379 5316 ..., 5071 4799 5149]
[5013 363 437 ..., 346 262 4355]
[5379 410 344 ..., 392 604 3377]
...,
[ 435 362 308 ..., 275 198 1632]
[ 548 392 290 ..., 248 263 1653]
[ 466 789 736 ..., 1835 1725 1940]]
ipdb> print l_var.min()
0
```
哦,天啊,只有整合和0的变体。这就是我们的Bug,我们正在做整数算术。
**在数字错误上抛出异常**
当我们运行`wiener_filtering.py`文件时,将抛出下列警告:
In [3]:
```
%run wiener_filtering.py
```
```
wiener_filtering.py:40: RuntimeWarning: divide by zero encountered in divide
noise_level = (1 - noise/l_var )
```
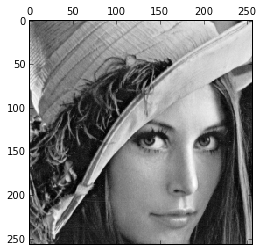
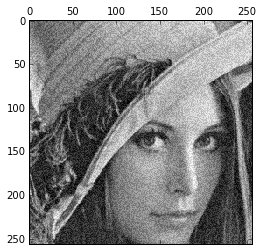

我们可以将这些警告变成异常,这使我们可以做事后剖析对他们进行查错,更快的找到我们的问题:
In [5]:
```
np.seterr(all='raise')
```
Out[5]:
```
{'divide': 'warn', 'invalid': 'warn', 'over': 'warn', 'under': 'ignore'}
```
In [6]:
```
%run wiener_filtering.py
```
```
---------------------------------------------------------------------------
FloatingPointError Traceback (most recent call last)
/Users/cloga/Documents/scipy-lecture-notes_cn/wiener_filtering.py in <module>()
55 pl.matshow(noisy_lena[cut], cmap=pl.cm.gray)
56
---> 57 denoised_lena = iterated_wiener(noisy_lena)
58 pl.matshow(denoised_lena[cut], cmap=pl.cm.gray)
59
/Users/cloga/Documents/scipy-lecture-notes_cn/wiener_filtering.py in iterated_wiener(noisy_img, size)
38 res = noisy_img - denoised_img
39 noise = (res**2).sum()/res.size
---> 40 noise_level = (1 - noise/l_var )
41 noise_level[noise_level<0] = 0
42 denoised_img += noise_level*res
FloatingPointError: divide by zero encountered in divide
```
#### 2.3.3.1.3 启动除错器的其他的方式
* 人为设置断点抛出异常
如果你发现记录行数设置断点很枯燥,那么你也可以直接在你想要检查的位置抛出异常然后使用IPython的`%debug`。注意这种情况下,你无法步进或继续这个异常。
* 用nosetests除错测试失败
你可以运行`nosetests --pdb`来进入异常除错的事后剖析,运行`nosetests --pdb-failure`来用除错器检查失败的测试。
此外,你可以通过安装nose插件[ipdbplugin](http://pypi.python.org/pypi/ipdbplugin)来在nose中为除错器使用Ipython界面。然后为nosetest传递`--ipdb`和`--ipdb-failure`选项。
* 显性的调用除错器
在你想要进入除错器的地方插入下列几行:
In [ ]:
```
import pdb; pdb.set_trace()
```
**警告**:当运行nosetests时, 会抓取输出,因此会感觉除错器没起作用。只要运行nosetests用-s标记。
**图形化除错器和其他除错器**
* 对于在代码中步进和检查变量,你会发现用图形化除错器比如[winpdb](http://winpdb.org/),
* 或者,[pudb](http://pypi.python.org/pypi/pudb)是优秀的半图形除错器,在控制台带有文字用户界面。
* 同时,[pydbgr]项目可能也是值得一看的。
### 2.3.3.2 除错器命令和交互
| | |
| --- | --- |
| l(list) | 列出当前位置的代码 |
| u(p) | 在调用栈上向上走 |
| d(own) | 在调用栈上向下走 |
| n(ext) | 执行下一行代码(并不会进入新函数) |
| s(tep) | 执行下一个语句(并不会进入新函数) |
| bt | 打印调用栈 |
| a | 打印本地函数 |
| !command | 执行给到的Python命令(与pdb命令相对) |
**警告:除错器命令不是Python代码**
你不能以想要的方式命名变量。例如,如果你无法在当前的框架下用相同的名字覆盖变量:**用不同的名字,然后在除错器中输入代码时使用本地变量**。
#### 2.3.3.2.1 在除错器中获得帮助
输入`h`或者`help`来进入交互帮助:
In [ ]:
```
import pdb; pdb.set_trace()
```
```
--Call--
> /Library/Frameworks/Python.framework/Versions/2.7/lib/python2.7/site-packages/IPython/core/displayhook.py(222)__call__()
-> def __call__(self, result=None):
(Pdb) help
Documented commands (type help <topic>):
========================================
EOF bt cont enable jump pp run unt
a c continue exit l q s until
alias cl d h list quit step up
args clear debug help n r tbreak w
b commands disable ignore next restart u whatis
break condition down j p return unalias where
Miscellaneous help topics:
==========================
exec pdb
Undocumented commands:
======================
retval rv
```
## 2.3.4 用gdb除错段错误(segmentation faults)
如果有段错误,你不可以用pdb对它进行除错,因为在进入除错器之前,它会让Python解释器崩溃。同样的,如果在嵌入Python的C代码中有一个bug,pdb也是没用的。对于这种情况,我们可以转用gnu除错器,[gdb](http://www.gnu.org/s/gdb/),在Linux可用。
在我们开始使用gdb之前,让我们为它添加一些Python专有的工具。对于这个情况我们可以添加一些宏到我们的`~/.gbdinit`。宏的最优的选择取决于你的Python版本和gdb版本。我在[gdbint](http://scipy-lectures.github.io/_downloads/gdbinit)添加了一个简单的版本,但是别客气读一下[DebuggingWithGdb](http://wiki.python.org/moin/DebuggingWithGdb)。
要用gdb来除错Python脚本[segfault.py](http://scipy-lectures.github.io/_downloads/segfault.py), 我们可以想如下这样在gdb中运行这个脚本
```
$ gdb python
...
(gdb) run segfault.py
Starting program: /usr/bin/python segfault.py
[Thread debugging using libthread_db enabled]
Program received signal SIGSEGV, Segmentation fault.
_strided_byte_copy (dst=0x8537478 "\360\343G", outstrides=4, src=
0x86c0690 <Address 0x86c0690 out of bounds>, instrides=32, N=3,
elsize=4)
at numpy/core/src/multiarray/ctors.c:365
365 _FAST_MOVE(Int32);
(gdb)
```
我们得到了一个segfault, gdb捕捉到它在C级栈(并不是Python调用栈)中进行事后剖析除错。我们可以用gdb的命令来对C调用栈进行除错:
```
(gdb) up
#1 0x004af4f5 in _copy_from_same_shape (dest=<value optimized out>,
src=<value optimized out>, myfunc=0x496780 <_strided_byte_copy>,
swap=0)
at numpy/core/src/multiarray/ctors.c:748
748 myfunc(dit->dataptr, dest->strides[maxaxis],
```
如你所见,现在,我们numpy的C代码中。我们想要知道哪个Python代码触发了这个segfault,因此,在栈上向上搜寻,直到我们达到Python执行循环:
```
(gdb) up
#8 0x080ddd23 in call_function (f=
Frame 0x85371ec, for file /home/varoquau/usr/lib/python2.6/site-packages/numpy/core/arrayprint.py, line 156, in _leading_trailing (a=<numpy.ndarray at remote 0x85371b0>, _nc=<module at remote 0xb7f93a64>), throwflag=0)
at ../Python/ceval.c:3750
3750 ../Python/ceval.c: No such file or directory.
in ../Python/ceval.c
(gdb) up
#9 PyEval_EvalFrameEx (f=
Frame 0x85371ec, for file /home/varoquau/usr/lib/python2.6/site-packages/numpy/core/arrayprint.py, line 156, in _leading_trailing (a=<numpy.ndarray at remote 0x85371b0>, _nc=<module at remote 0xb7f93a64>), throwflag=0)
at ../Python/ceval.c:2412
2412 in ../Python/ceval.c
(gdb)
```
一旦我们进入了Python执行循环,我们可以使用特殊的Python帮助函数。例如我们可以找到对应的Python代码:
```
(gdb) pyframe
/home/varoquau/usr/lib/python2.6/site-packages/numpy/core/arrayprint.py (158): _leading_trailing
(gdb)
```
这是numpy代码,我们需要向上走直到找到我们写的代码:
```
(gdb) up
...
(gdb) up
#34 0x080dc97a in PyEval_EvalFrameEx (f=
Frame 0x82f064c, for file segfault.py, line 11, in print_big_array (small_array=<numpy.ndarray at remote 0x853ecf0>, big_array=<numpy.ndarray at remote 0x853ed20>), throwflag=0) at ../Python/ceval.c:1630
1630 ../Python/ceval.c: No such file or directory.
in ../Python/ceval.c
(gdb) pyframe
segfault.py (12): print_big_array
```
对应代码是:
In [1]:
```
def make_big_array(small_array):
big_array = stride_tricks.as_strided(small_array,
shape=(2e6, 2e6), strides=(32, 32))
return big_array
def print_big_array(small_array):
big_array = make_big_array(small_array)
```
这样segfault在打印`big_array[-10:]`时发生。原因非常简单,`big_array`被分配到程序内存以外。
**笔记:**对于在`gdbinit`中定义的Python特有命令,读一下这个文件的源代码。
**总结练习**
下面的脚本是详细而清晰的。它想要回答一个实际的有趣数值计算,但是,它并不起作用...你可以为它除错吗?
Python源代码:[to_debug.py](http://scipy-lectures.github.io/_downloads/to_debug.py)
In [ ]:
```
"""
A script to compare different root-finding algorithms.
This version of the script is buggy and does not execute. It is your task
to find an fix these bugs.
The output of the script sould look like:
Benching 1D root-finder optimizers from scipy.optimize:
brenth: 604678 total function calls
brentq: 594454 total function calls
ridder: 778394 total function calls
bisect: 2148380 total function calls
"""
from itertools import product
import numpy as np
from scipy import optimize
FUNCTIONS = (np.tan, # Dilating map
np.tanh, # Contracting map
lambda x: x**3 + 1e-4*x, # Almost null gradient at the root
lambda x: x+np.sin(2*x), # Non monotonous function
lambda x: 1.1*x+np.sin(4*x), # Fonction with several local maxima
)
OPTIMIZERS = (optimize.brenth, optimize.brentq, optimize.ridder,
optimize.bisect)
def apply_optimizer(optimizer, func, a, b):
""" Return the number of function calls given an root-finding optimizer,
a function and upper and lower bounds.
"""
return optimizer(func, a, b, full_output=True)[1].function_calls,
def bench_optimizer(optimizer, param_grid):
""" Find roots for all the functions, and upper and lower bounds
given and return the total number of function calls.
"""
return sum(apply_optimizer(optimizer, func, a, b)
for func, a, b in param_grid)
def compare_optimizers(optimizers):
""" Compare all the optimizers given on a grid of a few different
functions all admitting a signle root in zero and a upper and
lower bounds.
"""
random_a = -1.3 + np.random.random(size=100)
random_b = .3 + np.random.random(size=100)
param_grid = product(FUNCTIONS, random_a, random_b)
print "Benching 1D root-finder optimizers from scipy.optimize:"
for optimizer in OPTIMIZERS:
print '% 20s: % 8i total function calls' % (
optimizer.__name__,
bench_optimizer(optimizer, param_grid)
)
if __name__ == '__main__':
compare_optimizers(OPTIMIZERS)
```
In [1]:
```
%matplotlib inline
import numpy as np
```
2.2 高级Numpy
最后更新于:2022-04-01 11:21:40
# 2.2 高级Numpy
**作者**: Pauli Virtanen
Numpy是Python科学工具栈的基础。它的目的很简单:在一个内存块上实现针对多个物品的高效操作。了解它的工作细节有助于有效的使用它的灵活性,使用有用的快捷键,基于它构建新的工作。
这个指南的目的包括:
* 剖析Numpy数组,以及它的重要性。提示与技巧。
* 通用函数:什么是、为什么以及如果你需要一个全新的该做什么。
* 与其他工具整合:Numpy提供了一些方式将任意数据封装为ndarray,而不需要不必要的复制。
* 新近增加的功能,对我来说他们包含什么:PEP 3118 buffers、广义ufuncs, ...
**先决条件**
* Numpy (>= 1.2; 越新越好...)
* Cython (>= 0.12, 对于Ufunc例子)
* PIL (在一些例子中使用)
在这个部分,numpy将被如下引入:
In [2]:
```
import numpy as np
```
章节内容
* ndarry的一生
* 它是...
* 内存块
* 数据类型
* 索引体系:strides
* 剖析中的发现
* 通用函数
* 他们是什么?
* 练习:从零开始构建一个ufunc
* 答案:从零开始构建一个ufunc
* 广义ufuncs
* 协同工作功能
* 共享多维度,类型数据
* 旧的buffer协议
* 旧的buffer协议
* 数组接口协议
* 数组切片:`chararray`、`maskedarray`、`matrix`
* `chararray`:向量化字符操作
* `masked_array` 缺失值
* recarray:纯便利
* `matrix`:便利?
* 总结
* 为Numpy/Scipy做贡献
* 为什么
* 报告bugs
* 贡献文档
* 贡献功能
* 如何帮忙,总的来说
## 2.2.1 ndarray的一生
### 2.2.1.1 它是...
**ndarray** =
```
内存块 + 索引体系 + 数据类型描述符
```
* 原始数据
* 如何定义一个元素
* 如何解释一个元素 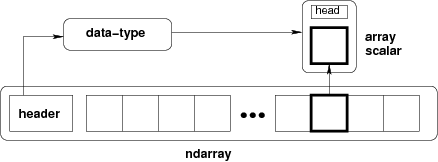
In [ ]:
```
typedef struct PyArrayObject {
PyObject_HEAD
/* Block of memory */
char *data;
/* Data type descriptor */
PyArray_Descr *descr;
/* Indexing scheme */
int nd;
npy_intp *dimensions;
npy_intp *strides;
/* Other stuff */
PyObject *base;
int flags;
PyObject *weakreflist;
} PyArrayObject;
```
### 2.2.1.2 内存块
In [5]:
```
x = np.array([1, 2, 3, 4], dtype=np.int32)
x.data
```
Out[5]:
```
<read-write buffer for 0x105ee2850, size 16, offset 0 at 0x105f880f0>
```
In [6]:
```
str(x.data)
```
Out[6]:
```
'\x01\x00\x00\x00\x02\x00\x00\x00\x03\x00\x00\x00\x04\x00\x00\x00'
```
数据的内存地址:
In [7]:
```
x.__array_interface__['data'][0]
```
Out[7]:
```
4352517296
```
完整的`__array_interface__`:
In [8]:
```
x.__array_interface__
```
Out[8]:
```
{'data': (4352517296, False),
'descr': [('', '<i4')],
'shape': (4,),
'strides': None,
'typestr': '<i4',
'version': 3}
```
提醒:两个`ndarrays`可以共享相同的内存:
In [9]:
```
x = np.array([1, 2, 3, 4])
y = x[:-1]
x[0] = 9
y
```
Out[9]:
```
array([9, 2, 3])
```
内存不必为一个`ndarray`拥有:
In [10]:
```
x = '1234'
y = np.frombuffer(x, dtype=np.int8)
y.data
```
Out[10]:
```
<read-only buffer for 0x105ee2e40, size 4, offset 0 at 0x105f883b0>
```
In [11]:
```
y.base is x
```
Out[11]:
```
True
```
In [12]:
```
y.flags
```
Out[12]:
```
C_CONTIGUOUS : True
F_CONTIGUOUS : True
OWNDATA : False
WRITEABLE : False
ALIGNED : True
UPDATEIFCOPY : False
```
`owndata`和`writeable`标记表明了内存块的状态。
也可以看一下:[array接口](http://docs.scipy.org/doc/numpy/reference/arrays.interface.html)
### 2.2.1.3 数据类型
#### 2.2.1.3.1 描述符
`dtype`描述了数组里的一个项目:
| | |
| --- | --- |
| type | 数据的**标量类型**,int8、int16、float64等之一(固定大小),str、unicode、void(可变大小) |
| itemsize | 数据块的**大小** |
| byteorder | **字节序**: big-endian `>` / little-endian `<` / 不可用 |
| fields | 子-dtypes,如果是一个**结构化的数据类型** |
| shape | 数组的形状,如果是一个**子数组** |
In [13]:
```
np.dtype(int).type
```
Out[13]:
```
numpy.int64
```
In [14]:
```
np.dtype(int).itemsize
```
Out[14]:
```
8
```
In [15]:
```
np.dtype(int).byteorder
```
Out[15]:
```
'='
```
#### 2.2.1.3.2 例子:读取.wav文件
The`.wav` file header:
| | |
| --- | --- |
| chunk_id | "RIFF" |
| chunk_size | 4字节无符号little-endian整型 |
| format | "WAVE" |
| fmt_id | "fmt " |
| fmt_size | 4字节无符号little-endian整型 |
| audio_fmt | 2字节无符号little-endian整型 |
| num_channels | 2字节无符号little-endian整型 |
| sample_rate | 4字节无符号little-endian整型 |
| byte_rate | 4字节无符号little-endian整型 |
| block_align | 2字节无符号little-endian整型 |
| bits_per_sample | 2字节无符号little-endian整型 |
| data_id | "data" |
| data_size | 4字节无符号little-endian整型 |
* 44字节块的原始数据(在文件的开头)
* ...接下来是`data_size` 实际声音数据的字节。
`.wav`文件头是Numpy结构化数据类型:
In [6]:
```
wav_header_dtype = np.dtype([
("chunk_id", (str, 4)), # flexible-sized scalar type, item size 4
("chunk_size", "<u4"), # little-endian unsigned 32-bit integer
("format", "S4"), # 4-byte string
("fmt_id", "S4"),
("fmt_size", "<u4"),
("audio_fmt", "<u2"), #
("num_channels", "<u2"), # .. more of the same ...
("sample_rate", "<u4"), #
("byte_rate", "<u4"),
("block_align", "<u2"),
("bits_per_sample", "<u2"),
("data_id", ("S1", (2, 2))), # sub-array, just for fun!
("data_size", "u4"),
#
# the sound data itself cannot be represented here:
# it does not have a fixed size
])
```
也可以看一下`wavreader.py`
In [5]:
```
wav_header_dtype['format']
```
Out[5]:
```
dtype('S4')
```
In [6]:
```
wav_header_dtype.fields
```
Out[6]:
```
<dictproxy {'audio_fmt': (dtype('uint16'), 20),
'bits_per_sample': (dtype('uint16'), 34),
'block_align': (dtype('uint16'), 32),
'byte_rate': (dtype('uint32'), 28),
'chunk_id': (dtype('S4'), 0),
'chunk_size': (dtype('uint32'), 4),
'data_id': (dtype(('S1', (2, 2))), 36),
'data_size': (dtype('uint32'), 40),
'fmt_id': (dtype('S4'), 12),
'fmt_size': (dtype('uint32'), 16),
'format': (dtype('S4'), 8),
'num_channels': (dtype('uint16'), 22),
'sample_rate': (dtype('uint32'), 24)}>
```
In [7]:
```
wav_header_dtype.fields['format']
```
Out[7]:
```
(dtype('S4'), 8)
```
* 第一个元素是结构化数据中对应于名称`format`的子类型
* 第二个是它的从项目开始的偏移(以字节计算)
**练习**
小练习,通过使用偏移来创造一个“稀释”的dtype,只使用一些字段:
In [ ]:
```
wav_header_dtype = np.dtype(dict(
names=['format', 'sample_rate', 'data_id'],
offsets=[offset_1, offset_2, offset_3], # counted from start of structure in bytes
formats=list of dtypes for each of the fields,
))
```
并且用它来读取sample rate和`data_id`(就像子数组)。
In [7]:
```
f = open('data/test.wav', 'r')
wav_header = np.fromfile(f, dtype=wav_header_dtype, count=1)
f.close()
print(wav_header)
```
```
[ ('RIFF', 17402L, 'WAVE', 'fmt ', 16L, 1, 1, 16000L, 32000L, 2, 16, [['d', 'a'], ['t', 'a']], 17366L)]
```
In [8]:
```
wav_header['sample_rate']
```
Out[8]:
```
array([16000], dtype=uint32)
```
让我们访问子数组:
In [9]:
```
wav_header['data_id']
```
Out[9]:
```
array([[['d', 'a'],
['t', 'a']]],
dtype='|S1')
```
In [10]:
```
wav_header.shape
```
Out[10]:
```
(1,)
```
In [11]:
```
wav_header['data_id'].shape
```
Out[11]:
```
(1, 2, 2)
```
当访问子数组时,维度被添加到末尾!
**注意:**有许多模块可以用于加载声音数据,比如`wavfile`、`audiolab`等...
#### 2.2.1.3.3 投射和再解释/视图
**投射**
* 赋值
* 数组构建
* 算术
* 等等
* 手动:`.astype(dtype)`
**data re-interpretation**
* 手动:`.view(dtype)`
##### 2.2.1.3.3.1 投射
* 算术投射,简而言之:
* 只有类型(不是值!)操作符最重要
* 最大的“安全”模式能代表选出的两者
* 在一些情况下,数组中的量值可能“丢失”
* 在通用复制数据中的投射:
In [4]:
```
x = np.array([1, 2, 3, 4], dtype=np.float)
x
```
Out[4]:
```
array([ 1., 2., 3., 4.])
```
In [5]:
```
y = x.astype(np.int8)
y
```
Out[5]:
```
array([1, 2, 3, 4], dtype=int8)
```
In [6]:
```
y + 1
```
Out[6]:
```
array([2, 3, 4, 5], dtype=int8)
```
In [7]:
```
y + 256
```
Out[7]:
```
array([257, 258, 259, 260], dtype=int16)
```
In [8]:
```
y + 256.0
```
Out[8]:
```
array([ 257., 258., 259., 260.])
```
In [9]:
```
y + np.array([256], dtype=np.int32)
```
Out[9]:
```
array([257, 258, 259, 260], dtype=int32)
```
* 集合项目上的投射:数组的dtype在项目赋值过程中不会改变:
In [10]:
```
y[:] = y + 1.5
y
```
Out[10]:
```
array([2, 3, 4, 5], dtype=int8)
```
**注意** 具体规则:见文档:[http://docs.scipy.org/doc/numpy/reference/ufuncs.html#casting-rules](http://docs.scipy.org/doc/numpy/reference/ufuncs.html#casting-rules)
##### 2.2.1.3.3.2 再解释/视图
* 内存中的数据块(4字节)
0x01 || 0x02 || 0x03 || 0x04
```
- 4 of uint8, OR,
- 4 of int8, OR,
- 2 of int16, OR,
- 1 of int32, OR,
- 1 of float32, OR,
- ...
```
如何从一个切换另一个?
* 切换dtype:
In [11]:
```
x = np.array([1, 2, 3, 4], dtype=np.uint8)
x.dtype = "<i2"
x
```
Out[11]:
```
array([ 513, 1027], dtype=int16)
```
In [12]:
```
0x0201, 0x0403
```
Out[12]:
```
(513, 1027)
```
0x01 0x02 || 0x03 0x04
**注意** little-endian:越不重要的字节在内存的左侧
* 创建新视图:
In [14]:
```
y = x.view("<i4")
y
```
Out[14]:
```
array([67305985], dtype=int32)
```
In [15]:
```
0x04030201
```
Out[15]:
```
67305985
```
0x01 0x02 0x03 0x04
**注意:**
* **`.view()`创建视图,并不复制(或改变)内存块**
* **只改变dtype(调整数组形状):**
In [16]:
```
x[1] = 5
```
In [17]:
```
y
```
Out[17]:
```
array([328193], dtype=int32)
```
In [18]:
```
y.base is x
```
Out[18]:
```
True
```
**小练习:数据再解释**
**也可以看一下:** `view-colors.py`
数组中的RGBA数据:
In [19]:
```
x = np.zeros((10, 10, 4), dtype=np.int8)
x[:, :, 0] = 1
x[:, :, 1] = 2
x[:, :, 2] = 3
x[:, :, 3] = 4
```
后三个维度是R、B和G,以及alpha渠道。
如何用字段名‘r’, ‘g’, ‘b’, ‘a’创建一个(10,10)结构化数组而不用复制数据?
In [ ]:
```
y = ...
assert (y['r'] == 1).all()
assert (y['g'] == 2).all()
assert (y['b'] == 3).all()
assert (y['a'] == 4).all()
```
答案
...
**警告:**另一个占有四个字节内存的数组:
In [21]:
```
y = np.array([[1, 3], [2, 4]], dtype=np.uint8).transpose()
x = y.copy()
x
```
Out[21]:
```
array([[1, 2],
[3, 4]], dtype=uint8)
```
In [22]:
```
y
```
Out[22]:
```
array([[1, 2],
[3, 4]], dtype=uint8)
```
In [23]:
```
x.view(np.int16)
```
Out[23]:
```
array([[ 513],
[1027]], dtype=int16)
```
In [24]:
```
0x0201, 0x0403
```
Out[24]:
```
(513, 1027)
```
In [25]:
```
y.view(np.int16)
```
Out[25]:
```
array([[ 769, 1026]], dtype=int16)
```
* 发生了什么?
* ... 我们需要实际看一下x[0,1]里面是什么
In [26]:
```
0x0301, 0x0402
```
Out[26]:
```
(769, 1026)
```
### 2.2.1.4 索引体系:步幅
#### 2.2.1.4.1 主要观点
**问题**
In [28]:
```
x = np.array([[1, 2, 3],
[4, 5, 6],
[7, 8, 9]], dtype=np.int8)
str(x.data)
```
Out[28]:
```
'\x01\x02\x03\x04\x05\x06\x07\x08\t'
```
item x[1,2]开始在`x.data`中的哪个字节?
**答案**(在Numpy)
* **步幅**:寻找一下个元素跳跃的字节数
* 每个维度一个步幅
In [29]:
```
x.strides
```
Out[29]:
```
(3, 1)
```
In [31]:
```
byte_offset = 3*1 + 1*2 # 查找x[1,2]
x.data[byte_offset]
```
Out[31]:
```
'\x06'
```
In [32]:
```
x[1, 2]
```
Out[32]:
```
6
```
* 简单、**灵活**
##### 2.2.1.4.1.1 C和Fortran顺序
In [34]:
```
x = np.array([[1, 2, 3],
[4, 5, 6],
[7, 8, 9]], dtype=np.int16, order='C')
x.strides
```
Out[34]:
```
(6, 2)
```
In [35]:
```
str(x.data)
```
Out[35]:
```
'\x01\x00\x02\x00\x03\x00\x04\x00\x05\x00\x06\x00\x07\x00\x08\x00\t\x00'
```
* 需要跳跃6个字节寻找下一行
* 需要跳跃2个字节寻找下一列
In [36]:
```
y = np.array(x, order='F')
y.strides
```
Out[36]:
```
(2, 6)
```
In [37]:
```
str(y.data)
```
Out[37]:
```
'\x01\x00\x04\x00\x07\x00\x02\x00\x05\x00\x08\x00\x03\x00\x06\x00\t\x00'
```
* 需要跳跃2个字节寻找下一行
* 需要跳跃6个字节寻找下一列
更高维度也类似:
```
- C:最后的维度变化最快(=最小的步幅)
- F:最早的维度变化最快
```

**注意**:现在我们可以理解`.view()`的行为:
In [38]:
```
y = np.array([[1, 3], [2, 4]], dtype=np.uint8).transpose()
x = y.copy()
```
变换顺序不影响数据的内部布局,只是步幅
In [39]:
```
x.strides
```
Out[39]:
```
(2, 1)
```
In [40]:
```
y.strides
```
Out[40]:
```
(1, 2)
```
In [41]:
```
str(x.data)
```
Out[41]:
```
'\x01\x02\x03\x04'
```
In [42]:
```
str(y.data)
```
Out[42]:
```
'\x01\x03\x02\x04'
```
* 当解释为int16时结果会不同
* `.copy()`以C顺序(默认)创建新的数组
##### 2.2.1.4.1.2 用整数切片
* 通过仅改变形状、步幅和可能调整数据指针可以代表任何东西!
* 不用制造数据的副本
In [43]:
```
x = np.array([1, 2, 3, 4, 5, 6], dtype=np.int32)
y = x[::-1]
y
```
Out[43]:
```
array([6, 5, 4, 3, 2, 1], dtype=int32)
```
In [44]:
```
y.strides
```
Out[44]:
```
(-4,)
```
In [45]:
```
y = x[2:]
y.__array_interface__['data'][0] - x.__array_interface__['data'][0]
```
Out[45]:
```
8
```
In [46]:
```
x = np.zeros((10, 10, 10), dtype=np.float)
x.strides
```
Out[46]:
```
(800, 80, 8)
```
In [47]:
```
x[::2,::3,::4].strides
```
Out[47]:
```
(1600, 240, 32)
```
* 类似的,变换顺序绝不会创建副本(只是交换的步幅)
In [48]:
```
x = np.zeros((10, 10, 10), dtype=np.float)
x.strides
```
Out[48]:
```
(800, 80, 8)
```
In [49]:
```
x.T.strides
```
Out[49]:
```
(8, 80, 800)
```
但是:并不是所有的重排操作都可以通过操纵步幅来完成。
In [3]:
```
a = np.arange(6, dtype=np.int8).reshape(3, 2)
b = a.T
b.strides
```
Out[3]:
```
(1, 2)
```
到目前为止,都很不错,但是:
In [4]:
```
str(a.data)
```
Out[4]:
```
'\x00\x01\x02\x03\x04\x05'
```
In [5]:
```
b
```
Out[5]:
```
array([[0, 2, 4],
[1, 3, 5]], dtype=int8)
```
In [6]:
```
c = b.reshape(3*2)
c
```
Out[6]:
```
array([0, 2, 4, 1, 3, 5], dtype=int8)
```
这里,没办法用一个给定的步长和`a`的内存块来表示数组`c`。因此,重排操作在这里需要制作一个副本。
#### 2.2.1.4.2 例子:用步长伪造维度
**步长操作**
In [2]:
```
from numpy.lib.stride_tricks import as_strided
help(as_strided)
```
```
Help on function as_strided in module numpy.lib.stride_tricks:
as_strided(x, shape=None, strides=None)
Make an ndarray from the given array with the given shape and strides.
```
**警告**:`as_strided`并不检查你是否还待在内存块边界里..
In [9]:
```
x = np.array([1, 2, 3, 4], dtype=np.int16)
as_strided(x, strides=(2*2, ), shape=(2, ))
```
Out[9]:
```
array([1, 3], dtype=int16)
```
In [10]:
```
x[::2]
```
Out[10]:
```
array([1, 3], dtype=int16)
```
也可以看一下:stride-fakedims.py
**练习**
In [ ]:
```
array([1, 2, 3, 4], dtype=np.int8)
-> array([[1, 2, 3, 4],
[1, 2, 3, 4],
[1, 2, 3, 4]], dtype=np.int8)
```
仅使用`as_strided`.:
提示:byte_offset = stride[0]*index[0] + stride[1]*index[1] + ...
解密:
步长可以设置为0:
In [11]:
```
x = np.array([1, 2, 3, 4], dtype=np.int8)
y = as_strided(x, strides=(0, 1), shape=(3, 4))
y
```
Out[11]:
```
array([[1, 2, 3, 4],
[1, 2, 3, 4],
[1, 2, 3, 4]], dtype=int8)
```
In [12]:
```
y.base.base is x
```
Out[12]:
```
True
```
#### 2.2.1.4.3 广播
* 用它来做一些有用的事情:[1, 2, 3, 4]和[5, 6, 7]的外积
In [13]:
```
x = np.array([1, 2, 3, 4], dtype=np.int16)
x2 = as_strided(x, strides=(0, 1*2), shape=(3, 4))
x2
```
Out[13]:
```
array([[1, 2, 3, 4],
[1, 2, 3, 4],
[1, 2, 3, 4]], dtype=int16)
```
In [14]:
```
y = np.array([5, 6, 7], dtype=np.int16)
y2 = as_strided(y, strides=(1*2, 0), shape=(3, 4))
y2
```
Out[14]:
```
array([[5, 5, 5, 5],
[6, 6, 6, 6],
[7, 7, 7, 7]], dtype=int16)
```
In [15]:
```
x2 * y2
```
Out[15]:
```
array([[ 5, 10, 15, 20],
[ 6, 12, 18, 24],
[ 7, 14, 21, 28]], dtype=int16)
```
**...看起来有一些熟悉...**
In [16]:
```
x = np.array([1, 2, 3, 4], dtype=np.int16)
y = np.array([5, 6, 7], dtype=np.int16)
x[np.newaxis,:] * y[:,np.newaxis]
```
Out[16]:
```
array([[ 5, 10, 15, 20],
[ 6, 12, 18, 24],
[ 7, 14, 21, 28]], dtype=int16)
```
* 在内部,数组**广播**的确使用0步长来实现的。
#### 2.2.1.4.4 更多技巧:对角线
**也可以看一下** stride-diagonals.py
**挑战**
* 提取矩阵对角线的起点:(假定是C内存顺序):
In [ ]:
```
x = np.array([[1, 2, 3],
[4, 5, 6],
[7, 8, 9]], dtype=np.int32)
x_diag = as_strided(x, shape=(3,), strides=(???,))
```
* 提取第一个超级-对角线的起点[2,6]。
* 那么子对角线呢?
(后两个问题的提示:切片首先移动步长起点的点。)
答案
...
提取对角线:
In [6]:
```
x_diag = as_strided(x, shape=(3, ), strides=((3+1)*x.itemsize, ))
x_diag
```
Out[6]:
```
array([1, 5, 9], dtype=int32)
```
首先切片,调整数据指针:
In [8]:
```
as_strided(x[0, 1:], shape=(2, ), strides=((3+1)*x.itemsize, ))
```
Out[8]:
```
array([2, 6], dtype=int32)
```
In [9]:
```
as_strided(x[1:, 0], shape=(2, ), strides=((3+1)*x.itemsize, ))
```
Out[9]:
```
array([4, 8], dtype=int32)
```
**笔记**
In [7]:
```
y = np.diag(x, k=1)
y
```
Out[7]:
```
array([2, 6], dtype=int32)
```
但是
In [8]:
```
y.flags.owndata
```
Out[8]:
```
False
```
这是一个副本?!
**也可以看一下**stride-diagonals.py
**挑战**
计算张量的迹:
In [9]:
```
x = np.arange(5*5*5*5).reshape(5,5,5,5)
s = 0
for i in xrange(5):
for j in xrange(5):
s += x[j,i,j,i]
```
通过跨越并且在结果上使用`sum()`。
In [ ]:
```
y = as_strided(x, shape=(5, 5), strides=(TODO, TODO))
s2 = ...
assert s == s2
```
答案
...
In [ ]:
```
y = as_strided(x, shape=(5, 5), strides=((5*5*5 + 5)*x.itemsize,
(5*5 + 1)*x.itemsize))
s2 = y.sum()
```
#### 2.2.1.4.5 CPU缓存效果
内存布局可以影响性能:
In [13]:
```
x = np.zeros((20000,))
y = np.zeros((20000*67,))[::67]
x.shape, y.shape
```
Out[13]:
```
((20000,), (20000,))
```
In [14]:
```
%timeit x.sum()
```
```
The slowest run took 20.69 times longer than the fastest. This could mean that an intermediate result is being cached
10000 loops, best of 3: 15.4 µs per loop
```
In [15]:
```
%timeit y.sum()
```
```
The slowest run took 114.83 times longer than the fastest. This could mean that an intermediate result is being cached
10000 loops, best of 3: 53 µs per loop
```
In [16]:
```
x.strides, y.strides
```
Out[16]:
```
((8,), (536,))
```
**小步长更快?**
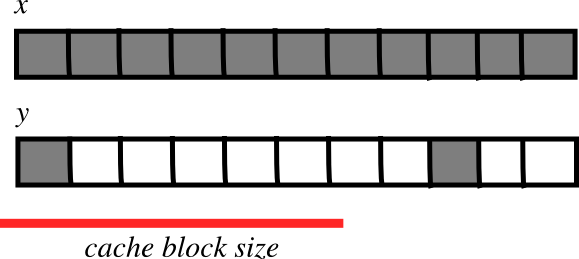
* CPU从主内存中拉取数据到缓存块 pulls data from main memory to its cache in blocks
* 如果需要数据项连续操作适应于一个内存块(小步长):
* 需要更少的迁移
* 更快
**也可以看一下**:`numexpr`设计用来减轻数组计算时的缓存效果。
#### 2.2.1.4.6 例子:原地操作(买者当心)
有时,
In [ ]:
```
a -= b
```
并不等同于
In [ ]:
```
a -= b.copy()
```
In [21]:
```
x = np.array([[1, 2], [3, 4]])
x -= x.transpose()
x
```
Out[21]:
```
array([[ 0, -1],
[ 1, 0]])
```
In [22]:
```
y = np.array([[1, 2], [3, 4]])
y -= y.T.copy()
y
```
Out[22]:
```
array([[ 0, -1],
[ 1, 0]])
```
* `x`和`x.transpose()`共享数据
* `x -= x.transpose()`逐个元素修改数据...
* 因为`x`和`x.transpose()`步长不同,修改后的数据重新出现在RHS
### 2.2.1.5 剖析上的发现

* _内存块_:可以共享,`.base`、`.data`
* _数据类型描述符_:结构化数据、子数组、字节顺序、投射、视图、`.astype()`、`.view()`
* _步长索引_:跨越、C/F-order、w/ 整数切片、`as_strided`、广播、跨越技巧、`diag`、CPU缓存一致性
## 2.2.2 通用函数
### 2.2.2.1 他们是什么?
* Ufunc在数组的所有元素上进行元素级操作。
例子:
`np.add`、`np.subtract`、`scipy.special`.*, ...
* 自动话支持:广播、投射...
* ufunc的作者只提供了元素级操作,Numpy负责剩下的。
* 元素级操作需要在C中实现(或者比如Cython)
#### 2.2.2.1.1 Ufunc的部分
* 由用户提供
In [ ]:
```
void ufunc_loop(void **args, int *dimensions, int *steps, void *data)
{
/*
* int8 output = elementwise_function(int8 input_1, int8 input_2)
*
* This function must compute the ufunc for many values at once,
* in the way shown below.
*/
char *input_1 = (char*)args[0];
char *input_2 = (char*)args[1];
char *output = (char*)args[2];
int i;
for (i = 0; i < dimensions[0]; ++i) {
*output = elementwise_function(*input_1, *input_2);
input_1 += steps[0];
input_2 += steps[1];
output += steps[2];
}
}
```
* Numpy部分,由下面的代码创建
In [ ]:
```
char types[3]
types[0] = NPY_BYTE /* type of first input arg */
types[1] = NPY_BYTE /* type of second input arg */
types[2] = NPY_BYTE /* type of third input arg */
PyObject *python_ufunc = PyUFunc_FromFuncAndData(
ufunc_loop,
NULL,
types,
1, /* ntypes */
2, /* num_inputs */
1, /* num_outputs */
identity_element,
name,
docstring,
unused)
```
```
- ufunc也可以支持多种不同输入输出类型组合。
```
#### 2.2.2.1.2 简化一下
`ufunc_loop`是非常通用的模式,Numpy提供了预制
| | |
| --- | --- |
| `PyUfunc_f_f` | `float elementwise_func(float input_1)` |
| `PyUfunc_ff_f` | `float elementwise_func(float input_1, float input_2)` |
| `PyUfunc_d_d` | `double elementwise_func(double input_1)` |
| `PyUfunc_dd_d` | `double elementwise_func(double input_1, double input_2)` |
| `PyUfunc_D_D` | `elementwise_func(npy_cdouble \*input, npy_cdouble\* output)` |
| `PyUfunc_DD_D` | `elementwise_func(npy_cdouble \*in1, npy_cdouble \*in2, npy_cdouble\* out)` |
```
- 只有需要提供`elementwise_func`
- ... 除非当你的元素级函数不是上面的形式中的任何一种
```
### 2.2.2.2 练习:从0开始构建一个ufunc
Mandelbrot分形由如下迭代定义:

`C=X+iy`是一个复数,只要Z仍然是有限的,无论迭代要跑多久,迭代都会重复。C属于Mandelbrot集。
* ufunc调用`mandel(z0, c)`计算:
In [ ]:
```
z = z0
for k in range(iterations):
z = z*z + c
```
比如,一百次迭代或者直到`z.real**2 + z.imag**2 > 1000`。用它来决定哪个`C`是在Mandelbrot集中。
* 我们的函数是很简单的,因此,请利用`PyUFunc_*`助手。
* 用Cython来完成
也可以看一下`mandel.pyx`,`mandelplot.py`
提醒:一些预设Ufunc循环:
| | |
| --- | --- |
| `PyUfunc_f_f` | `float elementwise_func(float input_1)` |
| `PyUfunc_ff_f` | `float elementwise_func(float input_1, float input_2)` |
| `PyUfunc_d_d` | `double elementwise_func(double input_1)` |
| `PyUfunc_dd_d` | `double elementwise_func(double input_1, double input_2)` |
| `PyUfunc_D_D` | `elementwise_func(complex_double *input, complex_double* output)` |
| `PyUfunc_DD_D` | `elementwise_func(complex_double *in1, complex_double *in2, complex_double* out)` |
打印代码:
NPY_BOOL, NPY_BYTE, NPY_UBYTE, NPY_SHORT, NPY_USHORT, NPY_INT, NPY_UINT, NPY_LONG, NPY_ULONG, NPY_LONGLONG, NPY_ULONGLONG, NPY_FLOAT, NPY_DOUBLE, NPY_LONGDOUBLE, NPY_CFLOAT, NPY_CDOUBLE, NPY_CLONGDOUBLE, NPY_DATETIME, NPY_TIMEDELTA, NPY_OBJECT, NPY_STRING, NPY_UNICODE, NPY_VOID
#### 2.2.2.3 答案:从0开始创建一个ufunc
In [ ]:
```
# The elementwise function
# ------------------------
cdef void mandel_single_point(double complex *z_in,
double complex *c_in,
double complex *z_out) nogil:
#
# The Mandelbrot iteration
#
#
# Some points of note:
#
# - It's *NOT* allowed to call any Python functions here.
#
# The Ufunc loop runs with the Python Global Interpreter Lock released.
# Hence, the ``nogil``.
#
# - And so all local variables must be declared with ``cdef``
#
# - Note also that this function receives *pointers* to the data;
# the "traditional" solution to passing complex variables around
#
cdef double complex z = z_in[0]
cdef double complex c = c_in[0]
cdef int k # the integer we use in the for loop
# Straightforward iteration
for k in range(100):
z = z*z + c
if z.real**2 + z.imag**2 > 1000:
break
# Return the answer for this point
z_out[0] = z
# Boilerplate Cython definitions
#
# You don't really need to read this part, it just pulls in
# stuff from the Numpy C headers.
# ----------------------------------------------------------
cdef extern from "numpy/arrayobject.h":
void import_array()
ctypedef int npy_intp
cdef enum NPY_TYPES:
NPY_CDOUBLE
cdef extern from "numpy/ufuncobject.h":
void import_ufunc()
ctypedef void (*PyUFuncGenericFunction)(char**, npy_intp*, npy_intp*, void*)
object PyUFunc_FromFuncAndData(PyUFuncGenericFunction* func, void** data,
char* types, int ntypes, int nin, int nout,
int identity, char* name, char* doc, int c)
void PyUFunc_DD_D(char**, npy_intp*, npy_intp*, void*)
# Required module initialization
# ------------------------------
import_array()
import_ufunc()
# The actual ufunc declaration
# ----------------------------
cdef PyUFuncGenericFunction loop_func[1]
cdef char input_output_types[3]
cdef void *elementwise_funcs[1]
loop_func[0] = PyUFunc_DD_D
input_output_types[0] = NPY_CDOUBLE
input_output_types[1] = NPY_CDOUBLE
input_output_types[2] = NPY_CDOUBLE
elementwise_funcs[0] = <void*>mandel_single_point
mandel = PyUFunc_FromFuncAndData(
loop_func,
elementwise_funcs,
input_output_types,
1, # number of supported input types
2, # number of input args
1, # number of output args
0, # `identity` element, never mind this
"mandel", # function name
"mandel(z, c) -> computes iterated z*z + c", # docstring
0 # unused
)
```
In [ ]:
```
import numpy as np
import mandel
x = np.linspace(-1.7, 0.6, 1000)
y = np.linspace(-1.4, 1.4, 1000)
c = x[None,:] + 1j*y[:,None]
z = mandel.mandel(c, c)
import matplotlib.pyplot as plt
plt.imshow(abs(z)**2 < 1000, extent=[-1.7, 0.6, -1.4, 1.4])
plt.gray()
plt.show()
```

**笔记**:大多数模板可以由下列Cython模块来自动完成: [http://wiki.cython.org/MarkLodato/CreatingUfuncs](http://wiki.cython.org/MarkLodato/CreatingUfuncs)
**一些可接受的输入类型**
例如:支持小数点后一位及两位两个准确度版本
In [ ]:
```
cdef void mandel_single_point(double complex *z_in,
double complex *c_in,
double complex *z_out) nogil:
...
cdef void mandel_single_point_singleprec(float complex *z_in,
float complex *c_in,
float complex *z_out) nogil:
...
cdef PyUFuncGenericFunction loop_funcs[2]
cdef char input_output_types[3*2]
cdef void *elementwise_funcs[1*2]
loop_funcs[0] = PyUFunc_DD_D
input_output_types[0] = NPY_CDOUBLE
input_output_types[1] = NPY_CDOUBLE
input_output_types[2] = NPY_CDOUBLE
elementwise_funcs[0] = <void*>mandel_single_point
loop_funcs[1] = PyUFunc_FF_F
input_output_types[3] = NPY_CFLOAT
input_output_types[4] = NPY_CFLOAT
input_output_types[5] = NPY_CFLOAT
elementwise_funcs[1] = <void*>mandel_single_point_singleprec
mandel = PyUFunc_FromFuncAndData(
loop_func,
elementwise_funcs,
input_output_types,
2, # number of supported input types <----------------
2, # number of input args
1, # number of output args
0, # `identity` element, never mind this
"mandel", # function name
"mandel(z, c) -> computes iterated z*z + c", # docstring
0 # unused
)
```
### 2.2.2.4 广义ufuncs
**ufunc**
`output = elementwise_function(input)`
`output`和`input`都可以只是一个数组元素。
**广义ufunc**
`output`和`input`可以是有固定维度数的数组
例如,矩阵迹(对象线元素的sum):
In [ ]:
```
input shape = (n, n)
output shape = () i.e. scalar
(n, n) -> ()
```
矩阵乘积:
In [ ]:
```
input_1 shape = (m, n)
input_2 shape = (n, p)
output shape = (m, p)
(m, n), (n, p) -> (m, p)
```
* 这是广义ufunc的”签名“
* g-ufunc发挥作用的维度是“核心维度”
**Numpy中的状态**
* g-ufuncs已经在Numpy中...
* 新的可以用`PyUFunc_FromFuncAndDataAndSignature`来创建
* ... 但是,除了测试外,我们不会配置公用的g-ufuncs,ATM
In [4]:
```
import numpy.core.umath_tests as ut
ut.matrix_multiply.signature
```
Out[4]:
```
'(m,n),(n,p)->(m,p)'
```
In [5]:
```
x = np.ones((10, 2, 4))
y = np.ones((10, 4, 5))
ut.matrix_multiply(x, y).shape
```
Out[5]:
```
(10, 2, 5)
```
* 后两个维度成为了核心维度,并且根据每个_签名_去修改
* 否则,g-ufunc“按元素级”运行
* 这种方式的矩阵乘法对一次在许多小矩阵是非常有用
**广义ufunc循环**
矩阵相乘 `(m,n),(n,p) -> (m,p)`
In [ ]:
```
void gufunc_loop(void **args, int *dimensions, int *steps, void *data)
{
char *input_1 = (char*)args[0]; /* these are as previously */
char *input_2 = (char*)args[1];
char *output = (char*)args[2];
int input_1_stride_m = steps[3]; /* strides for the core dimensions */
int input_1_stride_n = steps[4]; /* are added after the non-core */
int input_2_strides_n = steps[5]; /* steps */
int input_2_strides_p = steps[6];
int output_strides_n = steps[7];
int output_strides_p = steps[8];
int m = dimension[1]; /* core dimensions are added after */
int n = dimension[2]; /* the main dimension; order as in */
int p = dimension[3]; /* signature */
int i;
for (i = 0; i < dimensions[0]; ++i) {
matmul_for_strided_matrices(input_1, input_2, output,
strides for each array...);
input_1 += steps[0];
input_2 += steps[1];
output += steps[2];
}
}
```
## 2.2.3 互操性功能
### 2.2.3.1 多维度类型数据贡献
假设你
1. 写一个库处理(多维度)二进制数据,
2. 想要它可以用Numpy或者其他库来简单的操作数据,
3. ... 但是并不像依赖Numpy。
目前,三个解决方案:
* “旧的” buffer接口
* 数组接口
* “新的” buffer接口([PEP 3118](http://www.python.org/dev/peps/pep-3118))
### 2.2.3.2 旧的buffer协议
* 只有1-D buffers
* 没有数据类型信息
* C-级接口;`PyBufferProcs` `tp_as_buffer`在类型对象中
* 但是它被整合在Python中(比如,字符支持这个协议)
使用PIL(Python Imaging Library)的小练习:
也可以看一下:pilbuffer.py
In [ ]:
```
import Image
data = np.zeros((200, 200, 4), dtype=np.int8)
data[:, :] = [255, 0, 0, 255] # Red
# In PIL, RGBA images consist of 32-bit integers whose bytes are [RR,GG,BB,AA]
data = data.view(np.int32).squeeze()
img = Image.frombuffer("RGBA", (200, 200), data)
img.save('test.png')
```
**Q**: 检查一下如果`data`修改的话,再保存一下`img`看一下会发生什么。
### 2.2.3.3 旧的buffer协议
In [9]:
```
import numpy as np
# import Image
from PIL import Image
# Let's make a sample image, RGBA format
x = np.zeros((200, 200, 4), dtype=np.int8)
x[:,:,0] = 254 # red
x[:,:,3] = 255 # opaque
data = x.view(np.int32) # Check that you understand why this is OK!
img = Image.frombuffer("RGBA", (200, 200), data)
img.save('test.png')
#
# Modify the original data, and save again.
#
# It turns out that PIL, which knows next to nothing about Numpy,
# happily shares the same data.
#
x[:,:,1] = 254
img.save('test2.png')
```
```
/Library/Frameworks/Python.framework/Versions/2.7/lib/python2.7/site-packages/IPython/kernel/__main__.py:14: RuntimeWarning: the frombuffer defaults may change in a future release; for portability, change the call to read:
frombuffer(mode, size, data, 'raw', mode, 0, 1)
```

### 2.2.3.4 数组接口协议
* 多维度buffers
* 存在数据类型信息
* Numpy-特定方法;慢慢的废弃(不过不会消失)
* 然而,没有整合在Python中
**也可以看一下**:文档:[http://docs.scipy.org/doc/numpy/reference/arrays.interface.html](http://docs.scipy.org/doc/numpy/reference/arrays.interface.html)
In [8]:
```
x = np.array([[1, 2], [3, 4]])
x.__array_interface__
```
Out[8]:
```
{'data': (4298825184, False),
'descr': [('', '<i8')],
'shape': (2, 2),
'strides': None,
'typestr': '<i8',
'version': 3}
```
In [11]:
```
# import Image
from PIL import Image
img = Image.open('data/test.png')
img.__array_interface__
```
Out[11]:
```
{'data': '\xfe\x00\x00\xff\xfe\x00\x00...\xff\xfe\x00\x00\xff',
'shape': (200, 200, 4),
'typestr': '|u1'}
```
In [12]:
```
x = np.asarray(img)
x.shape
```
Out[12]:
```
(200, 200, 4)
```
In [13]:
```
x.dtype
```
Out[13]:
```
dtype('uint8')
```
**笔记**: 一个对C更友好的数组接口变体也被定义出来了。
## 2.2.4 数组的兄弟:chararray、maskedarray、matrix
### 2.2.4.1 chararray:: 向量化字符操作
In [14]:
```
x = np.array(['a', ' bbb', ' ccc']).view(np.chararray)
x.lstrip(' ')
```
Out[14]:
```
chararray(['a', 'bbb', 'ccc'],
dtype='|S5')
```
In [15]:
```
x.upper()
```
Out[15]:
```
chararray(['A', ' BBB', ' CCC'],
dtype='|S5')
```
**笔记**:`.view()`有另一个含义:它将一个ndarray变成专门的ndarray子类的一个实例
### 2.2.4.2 masked_array缺失数据
Masked arrays是有缺失或无效条目的数组。
例如,假如我们有一个第四个条目无效的数组:
In [16]:
```
x = np.array([1, 2, 3, -99, 5])
```
描述这个数组的一个方式是创建masked array:
In [17]:
```
mx = np.ma.masked_array(x, mask=[0, 0, 0, 1, 0])
mx
```
Out[17]:
```
masked_array(data = [1 2 3 -- 5],
mask = [False False False True False],
fill_value = 999999)
```
Masked平均数会忽略masked数据:
In [18]:
```
mx.mean()
```
Out[18]:
```
2.75
```
In [19]:
```
np.mean(mx)
```
Out[19]:
```
2.75
```
**警告**:不是所有的Numpy函数都接收mask,例如,`np.dot`,因此,请检查返回的类型。
`masked_array`返回原始数组的一个视图:
In [20]:
```
mx[1] = 9
x
```
Out[20]:
```
array([ 1, 9, 3, -99, 5])
```
#### 2.2.4.2.1 mask
你可以通过赋值来修改mask:
In [21]:
```
mx[1] = np.ma.masked
mx
```
Out[21]:
```
masked_array(data = [1 -- 3 -- 5],
mask = [False True False True False],
fill_value = 999999)
```
通过赋值可以清除mask:
In [22]:
```
mx[1] = 9
mx
```
Out[22]:
```
masked_array(data = [1 9 3 -- 5],
mask = [False False False True False],
fill_value = 999999)
```
mask也可以直接访问:
In [23]:
```
mx.mask
```
Out[23]:
```
array([False, False, False, True, False], dtype=bool)
```
masked条目可以通过填入一个给定值来变回一般的数组:
In [24]:
```
x2 = mx.filled(-1)
x2
```
Out[24]:
```
array([ 1, 9, 3, -1, 5])
```
mask也可以被清除:
In [25]:
```
mx.mask = np.ma.nomask
mx
```
Out[25]:
```
masked_array(data = [1 9 3 -99 5],
mask = [False False False False False],
fill_value = 999999)
```
#### 2.2.4.2.2 领域相关的函数
masked数组包也包含一些领域相关的函数:
In [26]:
```
np.ma.log(np.array([1, 2, -1, -2, 3, -5]))
```
Out[26]:
```
masked_array(data = [0.0 0.6931471805599453 -- -- 1.0986122886681098 --],
mask = [False False True True False True],
fill_value = 1e+20)
```
**笔记**:对于高效无缝处理数组中的缺失值的支持将在Numpy 1.7中出现。现在还在优化中!
**例子:Masked统计**
加拿大的护林员在计算1903-1918年野兔和猞猁的数量时有些心烦意乱,数字经常出错。(尽管胡萝卜农场主不断的警告。)计算随着时间推移的平均数,忽略无效数据。
In [4]:
```
data = np.loadtxt('data/populations.txt')
populations = np.ma.masked_array(data[:,1:])
year = data[:, 0]
bad_years = (((year >= 1903) & (year <= 1910))
| ((year >= 1917) & (year <= 1918)))
# '&' means 'and' and '|' means 'or'
populations[bad_years, 0] = np.ma.masked
populations[bad_years, 1] = np.ma.masked
populations.mean(axis=0)
```
Out[4]:
```
masked_array(data = [40472.72727272727 18627.272727272728 42400.0],
mask = [False False False],
fill_value = 1e+20)
```
In [5]:
```
populations.std(axis=0)
```
Out[5]:
```
masked_array(data = [21087.656489006717 15625.799814240254 3322.5062255844787],
mask = [False False False],
fill_value = 1e+20)
```
注意,Matplotlib了解masked数组:
In [8]:
```
plt.plot(year, populations, 'o-')
```
Out[8]:
```
[<matplotlib.lines.Line2D at 0x10565f250>,
<matplotlib.lines.Line2D at 0x10565f490>,
<matplotlib.lines.Line2D at 0x10565f650>]
```
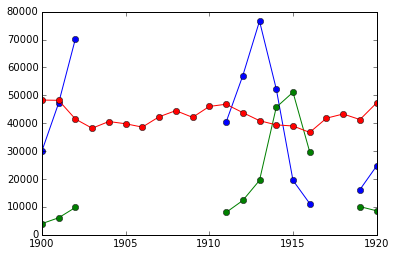
### 2.2.4.3 recarray:仅仅方便
In [9]:
```
arr = np.array([('a', 1), ('b', 2)], dtype=[('x', 'S1'), ('y', int)])
arr2 = arr.view(np.recarray)
arr2.x
```
Out[9]:
```
chararray(['a', 'b'],
dtype='|S1')
```
In [10]:
```
arr2.y
```
Out[10]:
```
array([1, 2])
```
### 2.2.4.4 矩阵:方便?
* 通常是2-D
* * 是矩阵的积,不是元素级的积
In [11]:
```
np.matrix([[1, 0], [0, 1]]) * np.matrix([[1, 2], [3, 4]])
```
Out[11]:
```
matrix([[1, 2],
[3, 4]])
```
## 2.2.5 总结
* ndarray的剖析:data、dtype, 步长
* 通用函数:元素级操作,如何常见一个新的通用函数
* Ndarray子类
* 整合其他工具的多种buffer接口
* 最近的补充:PEP 3118,广义ufuncs
## 2.2.6 为Numpy/Scipy做贡献
看一下这篇教程:[http://www.euroscipy.org/talk/882](http://www.euroscipy.org/talk/882)
### 2.2.6.1 为什么
* “这有个bug?”
* “我不理解这个要做什么?”
* “我有这个神器的代码。你要吗?”
* “我需要帮助!我应该怎么办?”
### 2.2.6.2 报告bugs
* Bug跟踪(推荐这种方式)
* [http://projects.scipy.org/numpy](http://projects.scipy.org/numpy)
* [http://projects.scipy.org/scipy](http://projects.scipy.org/scipy)
* 点击“注册”链接获得一个帐号
* 邮件列表 ( scipy.org/Mailing_Lists )
* 如果你不确定
* 在一周左右还没有任何回复?去开一个bug ticket吧。
#### 2.2.6.2.1 好的bug报告
Title: numpy.random.permutations fails for non-integer arguments
I'm trying to generate random permutations, using numpy.random.permutations
When calling numpy.random.permutation with non-integer arguments it fails with a cryptic error message::
```
>>> np.random.permutation(12)
array([ 6, 11, 4, 10, 2, 8, 1, 7, 9, 3, 0, 5])
>>> np.random.permutation(12.)
Traceback (most recent call last):
File "<stdin>", line 1, in <module>
File "mtrand.pyx", line 3311, in mtrand.RandomState.permutation
File "mtrand.pyx", line 3254, in mtrand.RandomState.shuffle
TypeError: len() of unsized object
```
This also happens with long arguments, and so np.random.permutation(X.shape[0]) where X is an array fails on 64 bit windows (where shape is a tuple of longs).
It would be great if it could cast to integer or at least raise a proper error for non-integer types.
I'm using Numpy 1.4.1, built from the official tarball, on Windows 64 with Visual studio 2008, on Python.org 64-bit Python.
1. 你要做什么?
2. **重现bug的小代码段**(如果可能的话)
* 实际上发生了什么
* 期望发生什么
3. 平台(Windows / Linux / OSX, 32/64 bits, x86/PPC, ...)
4. Numpy/Scipy的版本
In [2]:
```
print np.__version__
```
```
1.9.2
```
**检查下面的文件是你所期望的**
In [3]:
```
print np.__file__
```
```
/Library/Frameworks/Python.framework/Versions/2.7/lib/python2.7/site-packages/numpy/__init__.pyc
```
以免你想要旧/损坏的Numpy安装在哪里
如果不确定,试着删除现有的Numpy安装文件,并且重新安装...
### 2.2.6.3 为文档做贡献
1. 文档编辑器
* [http://docs.scipy.org/numpy](http://docs.scipy.org/numpy)
* 注册
* 注册一个帐号
* 订阅scipy-dev邮件列表(仅限订阅者)
* 邮件列表有问题:你可以发邮件
* 但是:**你可以关闭邮件送达**
* 在[http://mail.scipy.org/mailman/listinfo/scipy-dev](http://mail.scipy.org/mailman/listinfo/scipy-dev) 底部“改变你的订阅选项”
* 给@`scipy-dev`邮件列表发一封邮件;要求激活:
To: [[email protected]](/cdn-cgi/l/email-protection)
Hi,
I'd like to edit Numpy/Scipy docstrings. My account is XXXXX
Cheers, N. N.
```
- 检查一下风格指南:
- http://docs.scipy.org/numpy/
- 不要被吓住;要修补一个小事情,就修补它
```
* 编辑
2. 编辑源码发送补丁(和bug一样)
3. 向邮件列表抱怨
### 2.2.6.4 贡献功能
1. 在邮件列表上询问,如果不确定应该它应该在哪里
2. 写一个补丁,在bug跟踪器上添加一个增强的ticket
3. 或者,创建一个实现了这个功能的Git分支 + 添加增强ticket。
* 特别是对于大的/扩散性的功能添加
* [http://projects.scipy.org/numpy/wiki/GitMirror](http://projects.scipy.org/numpy/wiki/GitMirror)
* [http://www.spheredev.org/wiki/Git_for_the_lazy](http://www.spheredev.org/wiki/Git_for_the_lazy)
In [ ]:
```
# 克隆numpy仓库
git clone --origin svn http://projects.scipy.org/git/numpy.git numpy
cd numpy
# 创建功能分支
git checkout -b name-of-my-feature-branch svn/trunk
<edit stuff>
git commit -a
```
* 在[http://github.com](http://github.com) (或者其他地方)创建一个帐号
* @ Github创建一个新仓库
* 将你的工作推送到github
In [ ]:
```
git remote add github git@github:YOURUSERNAME/YOURREPOSITORYNAME.git
git push github name-of-my-feature-branch
```
### 2.2.6.5 如何帮助,总体而言
* 永远欢迎修补bug!
* 什么让你最恼怒
* 浏览一下跟踪器
* 文档工作
* API文档:改善文档字符串
* 很好的了解了一些Scipy模块
* 用户指南
* 最终需要完成
* 想要想一下?看一下目录 [http://scipy.org/Developer_Zone/UG_Toc](http://scipy.org/Developer_Zone/UG_Toc)
* 在沟通渠道上询问:
* `numpy-discussion`列表
* `scipy-dev`列表
In [1]:
```
%matplotlib inline
import numpy as np
```
2.1 Python高级功能(Constructs)
最后更新于:2022-04-01 11:21:38
# 2.1 Python高级功能(Constructs)
**作者**: Zbigniew Jędrzejewski-Szmek
这一章是关于Python语言的高级特性-从不是每种语言都有这些特性的角度来说,也可以从他们在更复杂的程序和库中更有用这个角度来说,但是,并不是说特别专业或特别复杂。
需要强调的是本章是纯粹关于语言本身-关于由特殊语法支持的特性,用于补充Python标准库的功能,聪明的外部模块不会实现这部分特性。
开发Python程序语言的流程、语法是惟一的因为非常透明,提议的修改会在公共邮件列表中从多种角度去评估,最终的决策是来自于想象中的用例的重要性、带来更多语言特性所产生的负担、与其他语法的一致性及提议的变化是否易于读写和理解的权衡。这个流程被定型在Python增强建议中-[PEPs](http://www.python.org/dev/peps/)。因此,本章中的特性都是在显示出确实解决了现实问题,并且他们的使用尽可能简洁后才被添加的。
## 2.1.1 迭代器、生成器表达式和生成器
### 2.1.1.1 迭代器
简洁
重复的工作是浪费,用一个标准的特性替代不同的自产方法通常使事物的可读性和共用性更好。 Guido van Rossum — [为Python添加可选的静态输入](http://www.artima.com/weblogs/viewpost.jsp?thread=86641)
迭代器是继承了[迭代协议](http://docs.python.org/dev/library/stdtypes.html#iterator-types)的对象-本质上,这意味着它有一个[next](http://docs.python.org/2.7/library/stdtypes.html#iterator.next)方法,调用时会返回序列中的下一个项目,当没有东西可返回时,抛出[StopIteration](http://docs.python.org/2.7/library/exceptions.html#exceptions.StopIteration)异常。
迭代器对象只允许循环一次。它保留了单次迭代中的状态(位置),或者从另外的角度来看,序列上的每次循环需要一个迭代器对象。这意味着我们可以在一个序列上同时循环多次。从序列上分离出循环逻辑使我们可以有不止一种方法去循环。
在容器上调用[__iter__](http://docs.python.org/2.7/reference/datamodel.html#object.__iter__)方法来创建一个迭代器对象是获得迭代器的最简单方式。[iter](http://docs.python.org/2.7/library/functions.html#iter)函数帮我们完成这项工作,节省了一些按键次数。
In [12]:
```
nums = [1,2,3] # 注意 ... 变化: 这些是不同的对象
iter(nums)
```
Out[12]:
```
<listiterator at 0x105f8b490>
```
In [2]:
```
nums.__iter__()
```
Out[2]:
```
<listiterator at 0x105bd9bd0>
```
In [3]:
```
nums.__reversed__()
```
Out[3]:
```
<listreverseiterator at 0x105bd9c50>
```
In [4]:
```
it = iter(nums)
next(it) # next(obj)是obj.next()的简便用法
```
Out[4]:
```
1
```
In [5]:
```
it.next()
```
Out[5]:
```
2
```
In [6]:
```
next(it)
```
Out[6]:
```
3
```
In [7]:
```
next(it)
```
```
---------------------------------------------------------------------------
StopIteration Traceback (most recent call last)
<ipython-input-7-2cdb14c0d4d6> in <module>()
----> 1 next(it)
StopIteration:
```
在一个循环上使用时,[StopIteration](http://docs.python.org/2.7/library/exceptions.html#exceptions.StopIteration) 被忍受了,使循环终止。但是,当显式调用时,我们可以看到一旦迭代器结束,再访问它会抛出异常。
使用[for..in](http://docs.python.org/2.7/reference/compound_stmts.html#for) 循环也使用`__iter__`方法。这个方法允许我们在序列上显式的开始一个循环。但是,如果我们已经有个迭代器,我们想要可以在一个循环中以同样的方式使用它。要做到这一点,迭代器及`next`也需要有一个称为`__iter__`的方法返回迭代器(`self`)。
Python中对迭代器的支持是普遍的:标准库中的所有的序列和无序容器都支持迭代器。这个概念也被扩展到其他的事情:例如文件对象支持按行循环。
In [10]:
```
f = open('./etc/fstab')
f is f.__iter__()
```
Out[10]:
```
True
```
`文件`是迭代器本身,它的`__iter__`方法并不创建一个新的对象:仅允许一个单一线程的序列访问。
### 2.1.1.2 生成器表达式
创建迭代器对象的第二种方式是通过生成器表达式,这也是列表推导的基础。要增加明确性,生成器表达式通常必须被括号或表达式包围。如果使用圆括号,那么创建了一个生成器迭代器。如果使用方括号,那么过程被缩短了,我们得到了一个列表。
In [13]:
```
(i for i in nums)
```
Out[13]:
```
<generator object <genexpr> at 0x105fbc320>
```
In [14]:
```
[i for i in nums]
```
Out[14]:
```
[1, 2, 3]
```
In [15]:
```
list(i for i in nums)
```
Out[15]:
```
[1, 2, 3]
```
在Python 2.7和3.x中,列表推导语法被扩展为**字典和集合推导**。当生成器表达式被大括号包围时创建一个`集合`。当生成器表达式包含一对`键:值`的形式时创建`字典`:
In [16]:
```
{i for i in range(3)}
```
Out[16]:
```
{0, 1, 2}
```
In [17]:
```
{i:i**2 for i in range(3)}
```
Out[17]:
```
{0: 0, 1: 1, 2: 4}
```
如果你还在前面一些Python版本,那么语法只是有一点不同:
In [18]:
```
set(i for i in 'abc')
```
Out[18]:
```
{'a', 'b', 'c'}
```
In [19]:
```
dict((i, ord(i)) for i in 'abc')
```
Out[19]:
```
{'a': 97, 'b': 98, 'c': 99}
```
生成器表达式非常简单,在这里没有什么多说的。只有一个疑难问题需要提及:在旧的Python中,索引变量(i)可以泄漏,在>=3以上的版本,这个问题被修正了。
### 2.1.1.3 生成器
生成器
生成器是一个可以产生一个结果序列而不是单一值的函数。
David Beazley — [协程和并发的有趣课程](http://www.dabeaz.com/coroutines/)
创建迭代器对应的第三种方法是调用生成器函数。**生成器**是包含关键字[yield](http://docs.python.org/2.7/reference/simple_stmts.html#yield)的函数。必须注意,只要这个关键词出现就会彻底改变函数的本质:这个`yield`关键字并不是必须激活或者甚至可到达,但是,会造成这个函数被标记为一个生成器。当普通函数被调用时,函数体内包含的指令就开始执行。当一个生成器被调用时,在函数体的第一条命令前停止执行。调用那个生成器函数创建一个生成器对象,继承迭代器协议。与调用普通函数一样,生成器也允许并发和递归。
当`next`被调用时,函数执行到第一个`yield`。每一次遇到`yield`语句都会给出`next`的一个返回值。执行完yield语句,就暂停函数的执行。
In [20]:
```
def f():
yield 1
yield 2
f()
```
Out[20]:
```
<generator object f at 0x105fbc460>
```
In [21]:
```
gen = f()
gen.next()
```
Out[21]:
```
1
```
In [22]:
```
gen.next()
```
Out[22]:
```
2
```
In [23]:
```
gen.next()
```
```
---------------------------------------------------------------------------
StopIteration Traceback (most recent call last)
<ipython-input-23-b2c61ce5e131> in <module>()
----> 1 gen.next()
StopIteration:
```
让我们进入一次调用生成器函数的生命周期。
In [24]:
```
def f():
print("-- start --")
yield 3
print("-- middle --")
yield 4
print("-- finished --")
gen = f()
next(gen)
```
```
-- start --
```
Out[24]:
```
3
```
In [25]:
```
next(gen)
```
```
-- middle --
```
Out[25]:
```
4
```
In [26]:
```
next(gen)
```
```
-- finished --
```
```
---------------------------------------------------------------------------
StopIteration Traceback (most recent call last)
<ipython-input-26-67c2d9ac4268> in <module>()
----> 1 next(gen)
StopIteration:
```
与普通函数不同,当执行`f()`时会立即执行第一个`print`,函数赋值到`gen`没有执行函数体内的任何语句。只有当用`next`激活`gen.next()`时,截至到第一个yield的语句才会被执行。第二个`next`打印`-- middle --`,执行到第二个`yield`终止。 第三个`next`打印`-- finished --`,并且到达了函数末尾。因为没有找到`yield`,抛出异常。
当向调用者传递控制时,在yield之后函数内发生了什么?每一个生成器的状态被存储在生成器对象中。从生成器函数的角度,看起来几乎是在一个独立的线程运行,但是,这是一个假象:执行是非常严格的单线程,但是解释器记录并恢复`next`值请求间的状态。
为什么生成器有用?正如迭代器部分的提到的,生成器只是创建迭代对象的不同方式。用`yield`语句可以完成的所有事,也都可以用`next`方法完成。尽管如此,使用函数,并让解释器执行它的魔法来创建迭代器有优势。函数比定义一个带有`next`和`__iter__`方法的类短很多。更重要的是,理解在本地变量中的状态比理解实例属性的状态对于生成器的作者来说要简单的多,对于后者来事必须要在迭代对象上不断调用`next`。
更广泛的问题是为什么迭代器有用?当迭代器被用于循环时,循环变的非常简单。初始化状态、决定循环是否结束以及寻找下一个值的代码被抽取到一个独立的的地方。这强调了循环体 - 有趣的部分。另外,这使在其他地方重用这些迭代体成为可能。
### 2.1.1.4 双向沟通
每个`yield`语句将一个值传递给调用者。这是由[PEP 255](http://www.python.org/dev/peps/pep-0255)(在Python2.2中实现)引入生成器简介的原因。但是,相反方向的沟通也是有用的。一个明显的方式可以是一些外部状态,全局变量或者是共享的可变对象。感谢[PEP 342](http://www.python.org/dev/peps/pep-0342)(在2.5中实现)使直接沟通成为可能。它通过将之前枯燥的`yeild`语句转换为表达式来实现。当生成器在一个`yeild`语句后恢复执行,调用者可以在生成器对象上调用一个方法,或者向生成器内部传递一个值,稍后由`yield`语句返回,或者一个不同的方法向生成器注入一个异常。
第一个新方法是[send(value)](http://docs.python.org/2.7/reference/expressions.html#generator.send),与[next()](http://docs.python.org/2.7/reference/expressions.html#generator.next)类似,但是,向生成器传递值用于`yield`表达式来使用。实际上,`g.next()`和`g.send(None)`是等价的。
第二个新方法是[throw(type, value=None, traceback=None)](http://docs.python.org/2.7/reference/expressions.html#generator.throw)等价于:
In [ ]:
```
raise type, value, traceback
```
在`yield`语句的点上。
与[raise](https://docs.python.org/2.7/reference/simple_stmts.html#raise)不同 (在当前执行的点立即抛出异常), `throw()`只是首先暂停生成器,然后抛出异常。挑选throw这个词是因为它让人联想到将异常放在不同的位置,这与其他语言中的异常相似。
当异常在生成器内部抛出时发生了什么?它可以是显性抛出或者当执行一些语句时,或者它可以注入在`yield`语句的点上,通过`throw()`方法的意思。在任何情况下,这些异常用一种标准方式传播:它可以被`except`或`finally`语句监听,或者在其他情况下,它引起生成器函数的执行中止,并且传播给调用者。
为了完整起见,应该提一下生成器迭代器也有[close()](http://docs.python.org/2.7/reference/expressions.html#generator.close)函数,可以用来强制一个可能在其他情况下提供更多的值的生成器立即结束。它允许生成器[**del**](http://docs.python.org/2.7/reference/datamodel.html#object.__del__)函数去销毁保持生成器状态的对象。
让我们定义一个生成器,打印通过send和throw传递的内容。
In [2]:
```
import itertools
def g():
print '--start--'
for i in itertools.count():
print '--yielding %i--' % i
try:
ans = yield i
except GeneratorExit:
print '--closing--'
raise
except Exception as e:
print '--yield raised %r--' % e
else:
print '--yield returned %s--' % ans
```
In [3]:
```
it = g()
next(it)
```
```
--start--
--yielding 0--
```
Out[3]:
```
0
```
In [4]:
```
it.send(11)
```
```
--yield returned 11--
--yielding 1--
```
Out[4]:
```
1
```
In [5]:
```
it.throw(IndexError)
```
```
--yield raised IndexError()--
--yielding 2--
```
Out[5]:
```
2
```
In [6]:
```
it.close()
```
```
--closing--
```
**next 还是 __next__?**
在Python2.X中,迭代器用于取回下一个值的方法是调用[next](http://docs.python.org/2.7/library/stdtypes.html#iterator.next)。它通过全局方法[next](http://docs.python.org/2.7/library/stdtypes.html#iterator.next)来唤醒,这意味着它应该调用__next__。就像全局函数[iter](http://docs.python.org/2.7/library/functions.html#iter)调用__iter__。在Python 3.X中修正了这种前后矛盾,it.next变成it.__next__。对于其他的生成器方法 - `send`和`throw`-情况更加复杂,因为解释器并不隐性的调用它们。尽管如此,人们提出一种语法扩展,以便允许`continue`接收一个参数,用于传递给循环的迭代器的[send](http://docs.python.org/2.7/reference/expressions.html#generator.send)。如果这个语法扩展被接受,那么可能`gen.send`将变成`gen.__send__`。最后一个生成器函数,[close](http://docs.python.org/2.7/reference/expressions.html#generator.close)非常明显是命名错误,因为,它已经隐性被唤起。
### 2.1.1.5 生成器链
**注**:这是[PEP 380](http://www.python.org/dev/peps/pep-0380)的预览(没有实现,但是已经被Python3.3接受)。
假设我们正在写一个生成器,并且我们想要量产(yield)由第二个生成器生成的一堆值,**子生成器**。如果只关心量产值,那么就可以没任何难度的用循环实现,比如
In [ ]:
```
for v in subgen:
yield v
```
但是,如果子生成器想要与调用者通过`send()`、`throw()`和`close()`正确交互,事情就会变得复杂起来。`yield`语句必须用[try..except..finally](http://docs.python.org/2.7/reference/compound_stmts.html#try)结构保护起来,与前面的生成器函数“degug”部分定义的类似。在[PEP 380](http://www.python.org/dev/peps/pep-0380#id13)提供了这些代码,现在可以说在Python 3.3中引入的新语法可以适当的从子生成器量产:
In [ ]:
```
yield from some_other_generator()
```
这个行为与上面的显性循环类似,重复从`some_other_generator`量产值直到生成器最后,但是,也可以向前对子生成器`send`、`throw`和`close`。
## 2.1.2 修饰器
概述
这个令人惊讶功能在这门语言中出现几乎是有歉意的,并且担心它是否真的那么有用。
Bruce Eckel — Python修饰器简介
因为函数或类是对象,因此他们都可以传递。因为可以是可变的对象,所以他们可以被修改。函数或类对象被构建后,但是在绑定到他们的名称之前的修改行为被称为修饰。
在“修饰器”这个名称后面隐藏了两件事-一件是进行修饰工作(即进行真实的工作)的函数,另一件是遵守修饰器语法的表达式,[[email protected]](/cdn-cgi/l/email-protection)
用函数的修饰器语法可以修饰函数:
In [ ]:
```
@decorator # ②
def function(): # ①
pass
```
* 用标准形式定义的函数。①
* [[email protected]](/cdn-cgi/l/email-protection)��[[email protected]](/cdn-cgi/l/email-protection),通常,这只是函数或类的名字。这部分首先被评估,在下面的函数定义完成后,修饰器被调用,同时将新定义的函数对象作为惟一的参数。修饰器的返回值被附加到函数的原始名称上。
修饰器可以被应用于函数和类。对于类,语法是一样的 - 原始类定义被作为一个参数来调用修饰器,并且无论返回什么都被赋给原始的名称。在修饰器语法实现之前([PEP 318](http://www.python.org/dev/peps/pep-0318)),通过将函数或类对象赋给一个临时的变量,然后显性引用修饰器,然后将返回值赋给函数的名称,也可以到达相同的效果。这听起来像是打更多的字,确实是这样,并且被修饰函数的名字也被打了两次,因为临时变量必须被使用至少三次,这很容易出错。无论如何,上面的例子等同于:
In [ ]:
```
def function(): # ①
pass
function = decorator(function) # ②
```
修饰器可以嵌套 - 应用的顺序是由底到顶或者由内到外。含义是最初定义的函数被第一个修饰器作为参数使用,第一个修饰器返回的内容被用于第二个修饰器的参数,...,最后一个修饰器返回的内容被绑定在最初的函数名称下。
选择这种修饰器语法是因为它的可读性。因为是在函数头之前指定的,很明显它并不是函数体的一部分,并且很显然它只能在整个函数上运行。因为,[[email protected]](/cdn-cgi/l/email-protection)("在你脸上",按照PEP的说法 :))。当使用多个修饰器时,每一个都是单独的一行,一种很容易阅读的方式。
### 2.1.2.1 替换或调整原始对象
修饰器可以返回相同的函数或类对象,也可以返回完全不同的对象。在第一种情况下,修饰器可以利用函数和类对象是可变的这个事实,并且添加属性,即为类添加修饰字符串。修饰器可以做一些有用的事甚至都不需要修改对象,例如,在全局登记中登记被修饰的类。在第二种情况下,虚拟任何东西都是可能的:当原始函数或类的一些东西被替换了,那么新对象就可以是完全不同的。尽管如此,这种行为不是修饰器的目的:他们的目的是微调被修饰的对象,而不是一些不可预测的东西。因此,当一个”被修饰的“函数被用一个不同的函数替换,新函数通常调用原始的函数,在做完一些预备工作之后。同样的,当”被修饰的“类被新的类替换,新类通常也来自原始类。让修饰器的目的是”每次“都做一些事情,比如在修饰器函数中登记每次调用,只能使用第二类修饰器。反过来,如果第一类就足够了,那么最好使用第一类,因为,它更简单。
### 2.1.2.2 像类和函数一样实现修饰器
修饰器的惟一一个要求是可以用一个参数调用。这意味着修饰器可以像一般函数一样实现,或者像类用__call__方法实现,或者在理论上,甚至是lambda函数。让我们比较一下函数和类的方法。修饰器表达式(@后面的部分)可以仅仅是一个名字,或者一次调用。仅使用名字的方式很好(输入少,看起来更整洁等),但是,只能在不需要参数来自定义修饰器时使用。作为函数的修饰器可以用于下列两个情况:
In [1]:
```
def simple_decorator(function):
print "doing decoration"
return function
@simple_decorator
def function():
print "inside function"
```
```
doing decoration
```
In [2]:
```
function()
```
```
inside function
```
In [6]:
```
def decorator_with_arguments(arg):
print "defining the decorator"
def _decorator(function):
# in this inner function, arg is available too
print "doing decoration,", arg
return function
return _decorator
@decorator_with_arguments("abc")
def function():
print "inside function"
```
```
defining the decorator
doing decoration, abc
```
上面两个修饰器属于返回原始函数的修饰器。如果他们返回一个新的函数,则需要更多一层的嵌套。在最坏的情况下,三层嵌套的函数。
In [7]:
```
def replacing_decorator_with_args(arg):
print "defining the decorator"
def _decorator(function):
# in this inner function, arg is available too
print "doing decoration,", arg
def _wrapper(*args, **kwargs):
print "inside wrapper,", args, kwargs
return function(*args, **kwargs)
return _wrapper
return _decorator
@replacing_decorator_with_args("abc")
def function(*args, **kwargs):
print "inside function,", args, kwargs
return 14
```
```
defining the decorator
doing decoration, abc
```
In [8]:
```
function(11, 12)
```
```
inside wrapper, (11, 12) {}
inside function, (11, 12) {}
```
Out[8]:
```
14
```
定义`_wrapper`函数来接收所有位置和关键词参数。通常,我们并不知道被修饰的函数可能接收什么参数,因此封装器函数只是向被封装的函数传递所有东西。一个不幸的结果是有误导性的表面函数列表。
与定义为函数的修饰器相比,定义为类的复杂修饰器更加简单。当一个对象创建后,__init__方法仅允许返回`None`,已创建的对象类型是不可以修改的。这意味着当一个被作为类创建后,因此使用少参模式没有意义:最终被修饰的对象只会是由构建器调用返回的修饰对象的一个实例,并不是十分有用。因此,只需要探讨在修饰器表达式中带有参数并且修饰器__init__方法被用于修饰器构建,基于类的修饰器。
In [9]:
```
class decorator_class(object):
def __init__(self, arg):
# this method is called in the decorator expression
print "in decorator init,", arg
self.arg = arg
def __call__(self, function):
# this method is called to do the job
print "in decorator call,", self.arg
return function
```
In [10]:
```
deco_instance = decorator_class('foo')
```
```
in decorator init, foo
```
In [11]:
```
@deco_instance
def function(*args, **kwargs):
print "in function,", args, kwargs
```
```
in decorator call, foo
```
In [12]:
```
function()
```
```
in function, () {}
```
与通用规则相比([PEP 8](http://www.python.org/dev/peps/pep-0008)),将修饰器写为类的行为更像是函数,因此,他们的名字通常是以小写字母开头。
在现实中,创建一个新类只有一个返回原始函数的修饰器是没有意义的。人们认为对象可以保留状态,当修饰器返回新的对象时,这个修饰器更加有用。
In [13]:
```
class replacing_decorator_class(object):
def __init__(self, arg):
# this method is called in the decorator expression
print "in decorator init,", arg
self.arg = arg
def __call__(self, function):
# this method is called to do the job
print "in decorator call,", self.arg
self.function = function
return self._wrapper
def _wrapper(self, *args, **kwargs):
print "in the wrapper,", args, kwargs
return self.function(*args, **kwargs)
```
In [14]:
```
deco_instance = replacing_decorator_class('foo')
```
```
in decorator init, foo
```
In [15]:
```
@deco_instance
def function(*args, **kwargs):
print "in function,", args, kwargs
```
```
in decorator call, foo
```
In [16]:
```
function(11, 12)
```
```
in the wrapper, (11, 12) {}
in function, (11, 12) {}
```
像这样一个修饰器可以非常漂亮的做任何事,因为它可以修改原始的函数对象和参数,调用或不调用原始函数,向后修改返回值。
### 2.1.2.3 复制原始函数的文档字符串和其他属性
当修饰器返回一个新的函数来替代原始的函数时,一个不好的结果是原始的函数名、原始的文档字符串和原始参数列表都丢失了。通过设置__doc__(文档字符串)、__module__和__name__(完整的函数),以及__annotations__(关于参数和返回值的额外信息,在Python中可用)可以部分”移植“这些原始函数的属性到新函数的设定。这可以通过使用[functools.update_wrapper](http://docs.python.org/2.7/library/functools.html#functools.update_wrapper)来自动完成。
In [ ]:In [17]:
```
import functools
def better_replacing_decorator_with_args(arg):
print "defining the decorator"
def _decorator(function):
print "doing decoration,", arg
def _wrapper(*args, **kwargs):
print "inside wrapper,", args, kwargs
return function(*args, **kwargs)
return functools.update_wrapper(_wrapper, function)
return _decorator
@better_replacing_decorator_with_args("abc")
def function():
"extensive documentation"
print "inside function"
return 14
```
```
defining the decorator
doing decoration, abc
```
In [18]:
```
function
```
Out[18]:
```
<function __main__.function>
```
In [19]:
```
print function.__doc__
```
```
extensive documentation
```
在属性列表中缺少了一个重要的东西:参数列表,这些属性可以复制到替换的函数。参数的默认值可以用`__defaults__`、`__kwdefaults__`属性来修改,但是,不幸的是参数列表本身不能设置为属性。这意味着`help(function)`将显示无用的参数列表,对于函数用户造成困扰。一种绕过这个问题的有效但丑陋的方法是使用`eval`来动态创建一个封装器。使用外部的`decorator`模块可以自动完成这个过程。它提供了对`decorator`装饰器的支持,给定一个封装器将它转变成保留函数签名的装饰器。
总结一下,装饰器通常应该用`functools.update_wrapper`或其他方式来复制函数属性。
### 2.1.2.4 标准类库中的实例
首先,应该说明,在标准类库中有一些有用的修饰器。有三类装饰器确实构成了语言的一部分:
* [classmethod](http://docs.python.org/2.7/library/functions.html#classmethod) 造成函数成为“类方法”,这意味着不需要创建类的实例就可以激活它。当普通的方法被激活后,解释器将插入一个实例对象作为第一个位置参数,`self`。当类方法被激活后,类自身被作为一点参数,通常称为`cls`。
类方法仍然可以通过类的命名空间访问,因此,他们不会污染模块的命名空间。类方法可以用来提供替代的构建器:
In [1]:
```
class Array(object):
def __init__(self, data):
self.data = data
@classmethod
def fromfile(cls, file):
data = numpy.load(file)
return cls(data)
```
```
这是一个清洁器,然后使用大量的标记来`__init__`。
```
* [staticmethod](http://docs.python.org/2.7/library/functions.html#staticmethod)用来让方法“静态”,即,从根本上只一个普通的函数,但是可以通过类的命名空间访问。当函数只在这个类的内部需要时(它的名字应该与_为前缀),或者当我们想要用户认为方法是与类关联的,尽管实施并不需要这样。
* [property](http://docs.python.org/2.7/library/functions.html#property)是对getters和setters pythonic的答案。用`property`修饰过的方法变成了一个getter,getter会在访问属性时自动调用。
In [2]:
```
class A(object):
@property
def a(self):
"an important attribute"
return "a value"
```
In [3]:
```
A.a
```
Out[3]:
```
<property at 0x104139260>
```
In [4]:
```
A().a
```
Out[4]:
```
'a value'
```
在这个例子中,`A.a`是只读的属性。它也写入了文档:`help(A)`包含从getter方法中拿过来的属性的文档字符串。将`a`定义为一个属性允许实时计算,副作用是它变成只读,因为没有定义setter。
要有setter和getter,显然需要两个方法。从Python 2.6开始,下列语法更受欢迎:
In [5]:
```
class Rectangle(object):
def __init__(self, edge):
self.edge = edge
@property
def area(self):
"""Computed area.
Setting this updates the edge length to the proper value.
"""
return self.edge**2
@area.setter
def area(self, area):
self.edge = area ** 0.5
```
这种方式有效是因为`property`修饰器用property对象替换getter方法。这个对象反过来有三个方法,`getter`、`setter`和`deleter`,可以作为修饰器。他们的任务是设置property对象的getter、 setter和deleter(存储为`fget`、`fset`和`fdel`属性)。当创建一个对象时,getter可以像上面的例子中进行设置。当定义一个setter,我们已经在`area`下有property对象,我们通过使用setter方法为它添加setter。所有的这些发生在我们创建类时。
接下来,当类的实例被创建后,property对象是特别的,当解释器执行属性访问,属性赋值或者属性删除时,任务被委托给property对象的方法。
为了让每个事情都清晰,让我们定义一个“debug”例子:
In [6]:
```
class D(object):
@property
def a(self):
print "getting", 1
return 1
@a.setter
def a(self, value):
print "setting", value
@a.deleter
def a(self):
print "deleting"
```
In [7]:
```
D.a
```
Out[7]:
```
<property at 0x104139520>
```
In [8]:
```
D.a.fget
```
Out[8]:
```
<function __main__.a>
```
In [9]:
```
D.a.fset
```
Out[9]:
```
<function __main__.a>
```
In [10]:
```
D.a.fdel
```
Out[10]:
```
<function __main__.a>
```
In [12]:
```
d = D() # ... varies, this is not the same `a` function
d.a
```
```
getting 1
```
Out[12]:
```
1
```
In [13]:
```
d.a = 2
```
```
setting 2
```
In [14]:
```
del d.a
```
```
deleting
```
In [15]:
```
d.a
```
```
getting 1
```
Out[15]:
```
1
```
属性是修饰语语法的极大扩展。修饰器语法的一个前提-名字不可以重复-被违背了,但是,到目前位置没有什么事变糟了。为getter、setter和deleter方法使用相同的名字是一个好风格。
一些更新的例子包括:
* functools.lru_cache 记忆任意一个函数保持有限的arguments\:answer对缓存(Python 3.2)
* [functools.total_ordering](http://docs.python.org/2.7/library/functools.html#functools.total_ordering)是一类修饰器,根据单一的可用方法(Python 2.7)补充缺失的顺序方法(**lt**, **gt**, **le**, ...)。
### 2.1.2.5 函数废弃
假如我们想要在我们不再喜欢的函数第一次激活时在`stderr`打印废弃警告。如果我们不像修改函数,那么我们可以使用修饰器:
In [16]:
```
class deprecated(object):
"""Print a deprecation warning once on first use of the function.
>>> @deprecated() # doctest: +SKIP
... def f():
... pass
>>> f() # doctest: +SKIP
f is deprecated
"""
def __call__(self, func):
self.func = func
self.count = 0
return self._wrapper
def _wrapper(self, *args, **kwargs):
self.count += 1
if self.count == 1:
print self.func.__name__, 'is deprecated'
return self.func(*args, **kwargs)
```
也可以将其实施为一个函数:
In [17]:
```
def deprecated(func):
"""Print a deprecation warning once on first use of the function.
>>> @deprecated # doctest: +SKIP
... def f():
... pass
>>> f() # doctest: +SKIP
f is deprecated
"""
count = [0]
def wrapper(*args, **kwargs):
count[0] += 1
if count[0] == 1:
print func.__name__, 'is deprecated'
return func(*args, **kwargs)
return wrapper
```
### 2.1.2.6 A while-loop删除修饰器
假如我们有一个函数返回事物列表,这个列表由循环创建。如果我们不知道需要多少对象,那么这么做的标准方式是像这样的:
In [18]:
```
def find_answers():
answers = []
while True:
ans = look_for_next_answer()
if ans is None:
break
answers.append(ans)
return answers
```
只要循环体足够紧凑,这是可以的。一旦循环体变得更加负责,就像在真实代码中,这种方法的可读性将很差。我们可以通过使用yield语句来简化,不过,这样的话,用户需要显性的调用列表(find_answers())。
我们可以定义一个修饰器来为我们构建修饰器:
In [19]:
```
def vectorized(generator_func):
def wrapper(*args, **kwargs):
return list(generator_func(*args, **kwargs))
return functools.update_wrapper(wrapper, generator_func)
```
接下来我们的函数变成:
In [ ]:
```
@vectorized
def find_answers():
while True:
ans = look_for_next_answer()
if ans is None:
break
yield ans
```
### 2.1.2.7 插件注册系统
这是一个不会修改类的类修饰器,但是,只要将它放在全局注册域。它会掉入返回原始对象的修饰器类别中:
In [21]:
```
class WordProcessor(object):
PLUGINS = []
def process(self, text):
for plugin in self.PLUGINS:
text = plugin().cleanup(text)
return text
@classmethod
def plugin(cls, plugin):
cls.PLUGINS.append(plugin)
@WordProcessor.plugin
class CleanMdashesExtension(object):
def cleanup(self, text):
return text.replace('—', u'\N{em dash}')
```
这里我们用修饰器来分权插件注册。修饰器是名词而不是动词,因为我们用它来声明我们的类是`WordProcessor`的一个插件。方法`plugin`只是将类添加到插件列表中。
关于这个插件本身多说一句:它用实际的Unicode的em-dash字符替换了em-dash HTML实体。它利用[unicode绝对标记](http://docs.python.org/2.7/reference/lexical_analysis.html#string-literals)来通过字符在unicode数据库(“EM DASH”)中的名字来插入字符。如果直接插入Unicode字符,将无法从程序源文件中区分en-dash。
### 2.1.2.8 更多例子和阅读
* [PEP 318](http://www.python.org/dev/peps/pep-0318)(函数和方法的修饰器语法)
* [PEP 3129](http://www.python.org/dev/peps/pep-3129)(类修饰器语法)
* [http://wiki.python.org/moin/PythonDecoratorLibrary](http://wiki.python.org/moin/PythonDecoratorLibrary)
* [http://docs.python.org/dev/library/functools.html](http://docs.python.org/dev/library/functools.html)
* [http://pypi.python.org/pypi/decorator](http://pypi.python.org/pypi/decorator)
* Bruce Eckel
* Decorators I: Introduction to Python Decorators
* Python Decorators II: Decorator Arguments
* Python Decorators III: A Decorator-Based Build System
## 2.1.3 上下文管理器
上下文管理器是带有`__enter__`和`__exit__`方法的对象,在with语句中使用:
In [ ]:
```
with manager as var:
do_something(var)
```
最简单的等价case是
In [ ]:
```
var = manager.__enter__()
try:
do_something(var)
finally:
manager.__exit__()
```
换句话说,在[PEP343](http://www.python.org/dev/peps/pep-0343)定义的上下文管理器协议,使将[try..except..finally](http://docs.python.org/2.7/reference/compound_stmts.html#try)结构中枯燥的部分抽象成一个独立的类,而只保留有趣的`do_something`代码块成为可能。
1. 首先调用[__enter__](http://docs.python.org/2.7/reference/datamodel.html#object.__enter__)方法。它会返回一个值被赋值给`var`。`as`部分是可选的:如果不存在,`__enter__`返回的值将被忽略。
2. `with`下面的代码段将被执行。就像`try`从句一样,它要么成功执行到最后,要么[break](http://docs.python.org/2.7/reference/simple_stmts.html#break)、[continue](http://docs.python.org/2.7/reference/simple_stmts.html#continue)或者[return](http://docs.python.org/2.7/reference/simple_stmts.html#return),或者它抛出一个异常。无论哪种方式,在这段代码结束后,都将调用[__exit__](http://docs.python.org/2.7/reference/datamodel.html#object.__exit__)。如果抛出异常,关于异常的信息会传递给`__exit__`,将在下一个部分描述。在一般的情况下,异常将被忽略,就像`finally`从句一样,并且将在`__exit__`结束时重新抛出。
假如我们想要确认一下文件是否在我们写入后马上关闭:
In [23]:
```
class closing(object):
def __init__(self, obj):
self.obj = obj
def __enter__(self):
return self.obj
def __exit__(self, *args):
self.obj.close()
with closing(open('/tmp/file', 'w')) as f:
f.write('the contents\n')
```
这里我们确保当`with`代码段退出后,`f.close()`被调用。因为关闭文件是非常常见的操作,对这个的支持已经可以在`file`类中出现。它有一个__exit__方法,调用了`close`并且被自己用于上下文管理器:
In [ ]:
```
with open('/tmp/file', 'a') as f:
f.write('more contents\n')
```
`try..finally`的常用用途是释放资源。不同的情况都是类似的实现:在`__enter__`阶段,是需要资源的,在`__exit__`阶段,资源被释放,并且异常,如果抛出的话,将被传递。就像with文件一样,当一个对象被使用后通常有一些自然的操作,最方便的方式是由一个内建的支持。在每一次发布中,Python都在更多的地方提供了支持:
* 所以类似文件的对象:
* [file](http://docs.python.org/2.7/library/functions.html#file) ➔ 自动关闭
* [fileinput](http://docs.python.org/2.7/library/fileinput.html#fileinput),[tempfile](http://docs.python.org/2.7/library/tempfile.html#tempfile) (py >= 3.2)
* [bz2.BZ2File](http://docs.python.org/2.7/library/bz2.html#bz2.BZ2File),[gzip.GzipFile](http://docs.python.org/2.7/library/gzip.html#gzip.GzipFile),[tarfile.TarFile](http://docs.python.org/2.7/library/tarfile.html#tarfile.TarFile),[zipfile.ZipFile](http://docs.python.org/2.7/library/zipfile.html#zipfile.ZipFile)
* [ftplib](http://docs.python.org/2.7/library/ftplib.html#ftplib),[nntplib](http://docs.python.org/2.7/library/nntplib.html#nntplib) ➔ 关闭连接 (py >= 3.2 或 3.3)
* 锁
* [multiprocessing.RLock](http://docs.python.org/2.7/library/multiprocessing.html#multiprocessing.RLock) ➔ 锁和解锁
* [multiprocessing.Semaphore](http://docs.python.org/2.7/library/multiprocessing.html#multiprocessing.Semaphore)
* [memoryview](http://docs.python.org/2.7/library/stdtypes.html#memoryview) ➔ 自动释放 (py >= 3.2 和 2.7)
* [decimal.localcontext](http://docs.python.org/2.7/library/decimal.html#decimal.localcontext) ➔ 临时修改计算的精度
* _winreg.PyHKEY ➔ 打开或关闭hive键
* warnings.catch_warnings ➔ 临时杀掉警告
* contextlib.closing ➔ 与上面的例子类似,调用`close`
* 并行程序
* concurrent.futures.ThreadPoolExecutor ➔ 激活并行,然后杀掉线程池 (py >= 3.2)
* concurrent.futures.ProcessPoolExecutor ➔ 激活并行,然后杀掉进程池 (py >= 3.2)
* nogil ➔ 临时解决GIL问题 (仅cython :( )
### 2.1.3.1 捕捉异常
当`with`代码块中抛出了异常,异常会作为参数传递给`__exit__`。与[sys.exc_info()](http://docs.python.org/2.7/library/sys.html#sys.exc_info)类似使用三个参数:type, value, traceback。当没有异常抛出时,`None`被用于三个参数。上下文管理器可以通过从`__exit__`返回true值来“吞下”异常。可以很简单的忽略异常,因为如果`__exit__`没有使用`return`,并且直接运行到最后,返回`None`,一个false值,因此,异常在`__exit__`完成后重新抛出。
捕捉异常的能力开启了一些有趣的可能性。一个经典的例子来自于单元测试-我们想要确保一些代码抛出正确类型的异常:
In [2]:
```
class assert_raises(object):
# based on pytest and unittest.TestCase
def __init__(self, type):
self.type = type
def __enter__(self):
pass
def __exit__(self, type, value, traceback):
if type is None:
raise AssertionError('exception expected')
if issubclass(type, self.type):
return True # swallow the expected exception
raise AssertionError('wrong exception type')
with assert_raises(KeyError):
{}['foo']
```
### 2.1.3.2 使用生成器定义上下文管理器
当讨论生成器时,曾说过与循环相比,我们更偏好将生成器实现为一个类,因为,他们更短、更美妙,状态存储在本地,而不是实例和变量。另一方面,就如在双向沟通中描述的,生成器和它的调用者之间的数据流动可以是双向的。这包含异常,可以在生成器中抛出。我们希望将上下文生成器实现为一个特殊的生成器函数。实际上,生成器协议被设计成可以支持这个用例。
In [ ]:
```
@contextlib.contextmanager
def some_generator(<arguments>):
<setup>
try:
yield <value>
finally:
<cleanup>
```
[contextlib.contextmanager](http://docs.python.org/2.7/library/contextlib.html#contextlib.contextmanager)帮助者可以将一个生成器转化为上下文管理器。生成器需要遵循一些封装器函数强加的规则--它必须`yield`一次。在`yield`之前的部分是从`__enter__`来执行,当生成器在`yield`挂起时,由上下文管理器保护的代码块执行。如果抛出异常,解释器通过`__exit__`参数将它交给封装器,然后封装器函数在`yield`语句的点抛出异常。通过使用生成器,上下文管理器更短和简单。
让我们将`closing`例子重写为一个生成器:
In [ ]:
```
@contextlib.contextmanager
def closing(obj):
try:
yield obj
finally:
obj.close()
```
让我们将`assert_raises`例子重写为生成器:
In [ ]:
```
@contextlib.contextmanager
def assert_raises(type):
try:
yield
except type:
return
except Exception as value:
raise AssertionError('wrong exception type')
else:
raise AssertionError('exception expected')
```
这里我们使用修饰器来将一个生成器函数转化为上下文管理器!
In [1]:
```
%matplotlib inline
import numpy as np
```
1.6 获取帮助及寻找文档
最后更新于:2022-04-01 11:21:35
# 1.6 获取帮助及寻找文档
与了解Numpy和Scipyzhong的所有函数相比,通过文档和可用帮助快捷的找到信息更重要。这里是获得信息的一些方式:
* 在Ipython中,`help 方法`打开函数的文档字符串。只需要输入函数名的起始字母,使用tab完成来显示匹配到的函数。
```
In [204]: help np.v
np.vander np.vdot np.version np.void0 np.vstack
np.var np.vectorize np.void np.vsplit
In [204]: help np.vander
```
在Ipython中无法为帮助和问答打开一个独立的窗口;但是,可以打开另一个Ipython shell仅显示帮助和文档字符串...
* Numpy和Scipy的文档可以在线查看[http://docs.scipy.org/doc](http://docs.scipy.org/doc) 。两个包的参考文档([http://docs.scipy.org/doc/numpy/reference/](http://docs.scipy.org/doc/numpy/reference/) 和 [http://docs.scipy.org/doc/scipy/reference/)中的搜索按钮非常有用。](http://docs.scipy.org/doc/scipy/reference/)中的搜索按钮非常有用。)
在这个网站上也可以找到不同主题的教程以及所有字符串文档的完整API。 
* Numpy和Scipy的文档由用户在wiki [http://docs.scipy.org/numpy/](http://docs.scipy.org/numpy/) (链接已经失效) 上定期丰富和更新。因此,一些字符串文档在wiki上更清晰想尽,你可能更想在wiki上读取文档而不是在官方文档网站上。注意任何人都可以在wiki上创建一个帐号来写更好的文档;这是为开源项目做贡献以及改善你所使用的工具的简单方式!
* Scipy的cookbook [http://www.scipy.org/Cookbook](http://www.scipy.org/Cookbook) 给出了许多常见问题的做法,比如拟合数据点,求解ODE等。
* Matplotlib网站 [http://matplotlib.sourceforge.net/](http://matplotlib.sourceforge.net/) 以一个拥有大量图表的非常漂亮的画廊为特色,每个图表都显示了源代码及生成的图表。这对于通过例子来学习非常有帮助。在网站上也可以找到更多的标准文档。

* Mayavi网站 [http://code.enthought.com/projects/mayavi/docs/development/html/mayavi/](http://code.enthought.com/projects/mayavi/docs/development/html/mayavi/) 也有非常漂亮的例子画廊 [http://code.enthought.com/projects/mayavi/docs/development/html/mayavi/auto/examples.html](http://code.enthought.com/projects/mayavi/docs/development/html/mayavi/auto/examples.html) ,人们可以查看不同的可视化方案。
最后,两个更加“技术”可能性也非常有用:
* 在Ipython中,魔法函数`%psearch`搜索匹配模式的对象。例如,如果不知道函数的准确名称,这将非常有用。
```
In [3]: import numpy as np
In [4]: %psearch np.diag*
np.diag
np.diagflat
np.diagonal
```
* `numpy.lookfor` 查找指定模块文档字符串中的关键字。
```
In [45]: numpy.lookfor('convolution')
Search results for 'convolution'
--------------------------------
numpy.convolve
Returns the discrete, linear convolution of two one-dimensional
sequences.
numpy.bartlett
Return the Bartlett window.
numpy.correlate
Discrete, linear correlation of two 1-dimensional sequences.
In [46]: numpy.lookfor('remove', module='os')
Search results for 'remove'
---------------------------
os.remove
remove(path)
os.removedirs
removedirs(path)
os.rmdir
rmdir(path)
os.unlink
unlink(path)
os.walk
Directory tree generator.
```
* 如果上面列出的所有方法都失败了(并且Google也没有答案)... 不要绝望!你的问题适合向邮件组写一封邮件:如果你很好的描述了你的问题,那么你应该会很快得到答案。Python科学计算的专家通过在邮件组给出非常有启发性的解释。
* Numpy讨论([[email protected]](/cdn-cgi/l/email-protection)): 全部是关于Numpy数组,操作数据,索引等问题。
* SciPy用户列表([[email protected]](/cdn-cgi/l/email-protection)): 用Python进行科学计算,高级数据处理,特别是scipy包的使用。
* [[email protected]](matplotlib-users@lists.sourceforge.net) 用matplotlib绘图。
In [1]:
```
%matplotlib inline
```
1.5 Scipy:高级科学计算
最后更新于:2022-04-01 11:21:33
# 1.5 Scipy:高级科学计算
作者:Adrien Chauve, Andre Espaze, Emmanuelle Gouillart, Gaël Varoquaux, Ralf Gommers
**Scipy**
`scipy`包包含许多专注于科学计算中的常见问题的工具箱。它的子模块对应于不同的应用,比如插值、积分、优化、图像处理、统计和特殊功能等。
`scipy`可以与其他标准科学计算包相对比,比如GSL (C和C++的GNU科学计算包), 或者Matlab的工具箱。`scipy`是Python中科学程序的核心程序包;这意味着有效的操作`numpy`数组,因此,numpy和scipy可以一起工作。
在实现一个程序前,有必要确认一下需要的数据处理时候已经在scipy中实现。作为非专业程序员,科学家通常倾向于**重新发明轮子**,这产生了小玩具、不优化、很难分享以及不可以维护的代码。相反,scipy的程序是优化并且测试过的,因此应该尽可能使用。
**警告** 这个教程根本不是数值计算的介绍。因为列举scipy的不同子模块和功能将会是非常枯燥的,相反我们将聚焦于列出一些例子,给出如何用scipy进行科学计算的大概思路。
scipy是由针对特定任务的子模块组成的:
| | |
| --- | --- |
| [`scipy.cluster`](http://docs.scipy.org/doc/scipy/reference/cluster.html#scipy.cluster "(in SciPy v0.13.0)") | 向量计算 / Kmeans |
| [`scipy.constants`](http://docs.scipy.org/doc/scipy/reference/constants.html#scipy.constants "(in SciPy v0.13.0)") | 物理和数学常量 |
| [`scipy.fftpack`](http://docs.scipy.org/doc/scipy/reference/fftpack.html#scipy.fftpack "(in SciPy v0.13.0)") | 傅里叶变换 |
| [`scipy.integrate`](http://docs.scipy.org/doc/scipy/reference/integrate.html#scipy.integrate "(in SciPy v0.13.0)") | 积分程序 |
| [`scipy.interpolate`](http://docs.scipy.org/doc/scipy/reference/interpolate.html#scipy.interpolate "(in SciPy v0.13.0)") | 插值 |
| [`scipy.io`](http://docs.scipy.org/doc/scipy/reference/io.html#scipy.io "(in SciPy v0.13.0)") | 数据输入和输出 |
| [`scipy.linalg`](http://docs.scipy.org/doc/scipy/reference/linalg.html#scipy.linalg "(in SciPy v0.13.0)") | 线性代数程序 |
| [`scipy.ndimage`](http://docs.scipy.org/doc/scipy/reference/ndimage.html#scipy.ndimage "(in SciPy v0.13.0)") | n-维图像包 |
| [`scipy.odr`](http://docs.scipy.org/doc/scipy/reference/odr.html#scipy.odr "(in SciPy v0.13.0)") | 正交距离回归 |
| [`scipy.optimize`](http://docs.scipy.org/doc/scipy/reference/optimize.html#scipy.optimize "(in SciPy v0.13.0)") | 优化 |
| [`scipy.signal`](http://docs.scipy.org/doc/scipy/reference/signal.html#scipy.signal "(in SciPy v0.13.0)") | 信号处理 |
| [`scipy.sparse`](http://docs.scipy.org/doc/scipy/reference/sparse.html#scipy.sparse "(in SciPy v0.13.0)") | 稀疏矩阵 |
| [`scipy.spatial`](http://docs.scipy.org/doc/scipy/reference/spatial.html#scipy.spatial "(in SciPy v0.13.0)") | 空间数据结构和算法 |
| [`scipy.special`](http://docs.scipy.org/doc/scipy/reference/special.html#scipy.special "(in SciPy v0.13.0)") | 一些特殊数学函数 |
| [`scipy.stats`](http://docs.scipy.org/doc/scipy/reference/stats.html#scipy.stats "(in SciPy v0.13.0)") | 统计 |
他们全都依赖于[numpy](http://docs.scipy.org/doc/numpy/reference/index.html#numpy), 但是大多数是彼此独立的。导入Numpy和Scipy的标准方式:
In [1]:
```
import numpy as np
from scipy import stats # 其他的子模块类似
```
`scipy`的主要命名空间通常包含的函数其实是numpy(试一下`scipy.cos`其实是`np.cos`) 。这些函数的暴露只是因为历史原因;通常没有必要在你的代码中使用`import scipy`。
## 1.5.1 文件输入/输出:[scipy.io](http://docs.scipy.org/doc/scipy/reference/io.html#scipy.io)
载入和保存matlab文件:
In [2]:
```
from scipy import io as spio
a = np.ones((3, 3))
spio.savemat('file.mat', {'a': a}) # savemat expects a dictionary
data = spio.loadmat('file.mat', struct_as_record=True)
data['a']
```
Out[2]:
```
array([[ 1., 1., 1.],
[ 1., 1., 1.],
[ 1., 1., 1.]])
```
```
from scipy import misc
misc.imread('fname.png')
# Matplotlib也有类似的方法
import matplotlib.pyplot as plt
plt.imread('fname.png')
```
更多请见:
* 加载文本文件:[numpy.loadtxt()](http://docs.scipy.org/doc/numpy/reference/generated/numpy.loadtxt.html#numpy.loadtxt)/[numpy.savetxt()](http://docs.scipy.org/doc/numpy/reference/generated/numpy.savetxt.html#numpy.savetxt)
* 智能加载文本/csv文件:[numpy.genfromtxt()](http://docs.scipy.org/doc/numpy/reference/generated/numpy.genfromtxt.html#numpy.genfromtxt)/numpy.recfromcsv()
* 快速有效,但是针对numpy的二进制格式:[numpy.save()](http://docs.scipy.org/doc/numpy/reference/generated/numpy.save.html#numpy.save)/[numpy.load()](http://docs.scipy.org/doc/numpy/reference/generated/numpy.load.html#numpy.load)
## 1.5.2 特殊函数:[scipy.special](http://docs.scipy.org/doc/scipy/reference/special.html#scipy.special)
特殊函数是超验函数。[scipy.special](http://docs.scipy.org/doc/scipy/reference/special.html#scipy.special)模块的文档字符串写的很详细,因此我们不会在这里列出所有的函数。常用的一些函数如下:
* 贝塞尔函数,比如`scipy.special.jn()` (第n个整型顺序的贝塞尔函数)
* 椭圆函数 (`scipy.special.ellipj()` Jacobian椭圆函数, ...)
* Gamma 函数: scipy.special.gamma(), 也要注意 `scipy.special.gammaln()` 将给出更高准确数值的 Gamma的log。
* Erf, 高斯曲线的面积:scipy.special.erf()
## 1.5.3 线性代数操作:[scipy.linalg](http://docs.scipy.org/doc/scipy/reference/linalg.html#scipy.linalg)
[scipy.linalg](http://docs.scipy.org/doc/scipy/reference/linalg.html#scipy.linalg) 模块提供了标准的线性代数操作,这依赖于底层的高效实现(BLAS、LAPACK)。
* [scipy.linalg.det()](http://docs.scipy.org/doc/scipy/reference/generated/scipy.linalg.det.html#scipy.linalg.det) 函数计算方阵的行列式:
In [3]:
```
from scipy import linalg
arr = np.array([[1, 2],
[3, 4]])
linalg.det(arr)
```
Out[3]:
```
-2.0
```
In [4]:
```
arr = np.array([[3, 2],
[6, 4]])
linalg.det(arr)
```
Out[4]:
```
0.0
```
In [5]:
```
linalg.det(np.ones((3, 4)))
```
```
---------------------------------------------------------------------------
ValueError Traceback (most recent call last)
<ipython-input-5-4d4672bd00a7> in <module>()
----> 1 linalg.det(np.ones((3, 4)))
/Library/Python/2.7/site-packages/scipy/linalg/basic.pyc in det(a, overwrite_a, check_finite)
440 a1 = np.asarray(a)
441 if len(a1.shape) != 2 or a1.shape[0] != a1.shape[1]:
--> 442 raise ValueError('expected square matrix')
443 overwrite_a = overwrite_a or _datacopied(a1, a)
444 fdet, = get_flinalg_funcs(('det',), (a1,))
ValueError: expected square matrix
```
* [scipy.linalg.inv()](http://docs.scipy.org/doc/scipy/reference/generated/scipy.linalg.inv.html#scipy.linalg.inv) 函数计算逆方阵:
In [6]:
```
arr = np.array([[1, 2],
[3, 4]])
iarr = linalg.inv(arr)
iarr
```
Out[6]:
```
array([[-2\. , 1\. ],
[ 1.5, -0.5]])
```
In [7]:
```
np.allclose(np.dot(arr, iarr), np.eye(2))
```
Out[7]:
```
True
```
最后计算逆奇异矩阵(行列式为0)将抛出`LinAlgError` :
In [8]:
```
arr = np.array([[3, 2],
[6, 4]])
linalg.inv(arr)
```
```
---------------------------------------------------------------------------
LinAlgError Traceback (most recent call last)
<ipython-input-8-e8078a9a17b2> in <module>()
1 arr = np.array([[3, 2],
2 [6, 4]])
----> 3 linalg.inv(arr)
/Library/Python/2.7/site-packages/scipy/linalg/basic.pyc in inv(a, overwrite_a, check_finite)
381 inv_a, info = getri(lu, piv, lwork=lwork, overwrite_lu=1)
382 if info > 0:
--> 383 raise LinAlgError("singular matrix")
384 if info < 0:
385 raise ValueError('illegal value in %d-th argument of internal '
LinAlgError: singular matrix
```
* 还有更多高级的操作,奇异值分解(SVD):
In [9]:
```
arr = np.arange(9).reshape((3, 3)) + np.diag([1, 0, 1])
uarr, spec, vharr = linalg.svd(arr)
```
结果的数组频谱是:
In [10]:
```
spec
```
Out[10]:
```
array([ 14.88982544, 0.45294236, 0.29654967])
```
原始矩阵可以用`svd`和`np.dot`矩阵相乘的结果重新获得:
In [11]:
```
sarr = np.diag(spec)
svd_mat = uarr.dot(sarr).dot(vharr)
np.allclose(svd_mat, arr)
```
Out[11]:
```
True
```
SVD常被用于统计和信号处理。其他标准分解 (QR, LU, Cholesky, Schur), 以及线性系统的求解器,也可以在[scipy.linalg](http://docs.scipy.org/doc/scipy/reference/linalg.html#scipy.linalg)中找到。
## 1.5.4 快速傅立叶变换:[scipy.fftpack](http://docs.scipy.org/doc/scipy/reference/fftpack.html#scipy.fftpack)
[scipy.fftpack](http://docs.scipy.org/doc/scipy/reference/fftpack.html#scipy.fftpack) 模块允许计算快速傅立叶变换。例子,一个(有噪音)的信号输入是这样:
In [12]:
```
time_step = 0.02
period = 5.
time_vec = np.arange(0, 20, time_step)
sig = np.sin(2 * np.pi / period * time_vec) + \
0.5 * np.random.randn(time_vec.size)
```
观察者并不知道信号的频率,只知道抽样时间步骤的信号`sig`。假设信号来自真实的函数,因此傅立叶变换将是对称的。[scipy.fftpack.fftfreq()](http://docs.scipy.org/doc/scipy/reference/generated/scipy.fftpack.fftfreq.html#scipy.fftpack.fftfreq) 函数将生成样本序列,而将计算快速傅立叶变换:
In [13]:
```
from scipy import fftpack
sample_freq = fftpack.fftfreq(sig.size, d=time_step)
sig_fft = fftpack.fft(sig)
```
因为生成的幂是对称的,寻找频率只需要使用频谱为正的部分:
In [14]:
```
pidxs = np.where(sample_freq > 0)
freqs = sample_freq[pidxs]
power = np.abs(sig_fft)[pidxs]
```
[](http://scipy-lectures.github.io/plot_directive/pyplots/fftpack_frequency.py)
寻找信号频率:
In [15]:
```
freq = freqs[power.argmax()]
np.allclose(freq, 1./period) # 检查是否找到了正确的频率
```
Out[15]:
```
True
```
现在高频噪音将从傅立叶转换过的信号移除:
In [16]:
```
sig_fft[np.abs(sample_freq) > freq] = 0
```
生成的过滤过的信号可以用[scipy.fftpack.ifft()](http://docs.scipy.org/doc/scipy/reference/generated/scipy.fftpack.ifft.html#scipy.fftpack.ifft)函数:
In [17]:
```
main_sig = fftpack.ifft(sig_fft)
```
查看结果:
In [18]:
```
import pylab as plt
plt.figure()
plt.plot(time_vec, sig)
plt.plot(time_vec, main_sig, linewidth=3)
plt.xlabel('Time [s]')
plt.ylabel('Amplitude')
```
```
/Library/Frameworks/Python.framework/Versions/2.7/lib/python2.7/site-packages/numpy/core/numeric.py:462: ComplexWarning: Casting complex values to real discards the imaginary part
return array(a, dtype, copy=False, order=order)
```
Out[18]:
```
<matplotlib.text.Text at 0x107484b10>
```
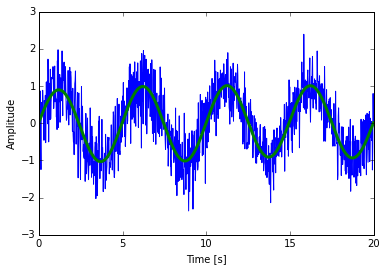
[numpy.fft](http://docs.scipy.org/doc/numpy/reference/routines.fft.html#numpy.fft)
Numpy也有一个FFT(numpy.fft)实现。但是,通常scipy的实现更受欢迎,因为,他使用更高效的底层实现。
**实例:寻找粗略周期**
[](http://scipy-lectures.github.io/plot_directive/intro/solutions/periodicity_finder.py)
[](http://scipy-lectures.github.io/plot_directive/intro/solutions/periodicity_finder.py)
**实例:高斯图片模糊**
弯曲:
$f_1(t) = \int dt'\, K(t-t') f_0(t')$
$\tilde{f}_1(\omega) = \tilde{K}(\omega) \tilde{f}_0(\omega)$
[](http://scipy-lectures.github.io/plot_directive/intro/solutions/image_blur.py)
**练习:月球登陆图片降噪**

1. 检查提供的图片moonlanding.png,图片被周期噪音污染了。在这个练习中,我们的目的是用快速傅立叶变换清除噪音。
2. 用`pylab.imread()`加载图片。
3. 寻找并使用在[scipy.fftpack](http://docs.scipy.org/doc/scipy/reference/fftpack.html#scipy.fftpack)中的2-D FFT函数,绘制图像的频谱(傅立叶变换)。在可视化频谱时是否遇到了麻烦?如果有的话,为什么?
4. 频谱由高频和低频成分构成。噪音被包含在频谱的高频部分,因此将那些部分设置为0(使用数组切片)。
5. 应用逆傅立叶变换来看一下结果图片。
## 1.5.5 优化及拟合:[scipy.optimize](http://docs.scipy.org/doc/scipy/reference/optimize.html#scipy.optimize)
优化是寻找最小化或等式的数值解的问题。
[scipy.optimize](http://docs.scipy.org/doc/scipy/reference/optimize.html#scipy.optimize) 模块提供了函数最小化(标量或多维度)、曲线拟合和求根的有用算法。
In [19]:
```
from scipy import optimize
```
**寻找标量函数的最小值**
让我们定义下面的函数:
In [20]:
```
def f(x):
return x**2 + 10*np.sin(x)
```
绘制它:
In [21]:
```
x = np.arange(-10, 10, 0.1)
plt.plot(x, f(x))
plt.show()
```
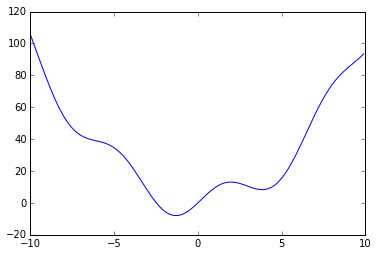
这个函数在-1.3附近有一个全局最小并且在3.8有一个局部最小。
找到这个函数的最小值的常用有效方式是从给定的初始点开始进行一个梯度下降。BFGS算法是这样做的较好方式:
In [22]:
```
optimize.fmin_bfgs(f, 0)
```
```
Optimization terminated successfully.
Current function value: -7.945823
Iterations: 5
Function evaluations: 24
Gradient evaluations: 8
```
Out[22]:
```
array([-1.30644003])
```
这个方法的一个可能问题是,如果这个函数有一些局部最低点,算法可能找到这些局部最低点而不是全局最低点,这取决于初始点:
In [23]:
```
optimize.fmin_bfgs(f, 3, disp=0)
```
Out[23]:
```
array([ 3.83746663])
```
如果我们不知道全局最低点,并且使用其临近点来作为初始点,那么我们需要付出昂贵的代价来获得全局最优。要找到全局最优点,最简单的算法是暴力算法,算法中会评估给定网格内的每一个点:
In [24]:
```
grid = (-10, 10, 0.1)
xmin_global = optimize.brute(f, (grid,))
xmin_global
```
Out[24]:
```
array([-1.30641113])
```
对于更大的网格,[scipy.optimize.brute()](http://docs.scipy.org/doc/scipy/reference/generated/scipy.optimize.brute.html#scipy.optimize.brute) 变得非常慢。[scipy.optimize.anneal()](http://docs.scipy.org/doc/scipy/reference/generated/scipy.optimize.anneal.html#scipy.optimize.anneal) 提供了一个替代的算法,使用模拟退火。对于不同类型的全局优化问题存在更多的高效算法,但是这超出了`scipy`的范畴。[OpenOpt](http://openopt.org/Welcome)、[IPOPT](https://github.com/xuy/pyipopt)、[PyGMO](http://pagmo.sourceforge.net/pygmo/index.html)和[PyEvolve](http://pyevolve.sourceforge.net/)是关于全局优化的一些有用的包。
要找出局部最低点,让我们用[scipy.optimize.fminbound](http://docs.scipy.org/doc/scipy/reference/generated/scipy.optimize.fminbound.html#scipy.optimize.fminbound)将变量限制在(0,10)区间:
In [25]:
```
xmin_local = optimize.fminbound(f, 0, 10)
xmin_local
```
Out[25]:
```
3.8374671194983834
```
**注**:寻找函数的最优解将在高级章节中:[数学优化:寻找函数的最优解](http://scipy-lectures.github.io/advanced/mathematical_optimization/index.html#mathematical-optimization)详细讨论。
**寻找标量函数的根**
要寻找上面函数f的根,比如`f(x)=0`的一个点,我们可以用比如[scipy.optimize.fsolve()](http://docs.scipy.org/doc/scipy/reference/generated/scipy.optimize.fsolve.html#scipy.optimize.fsolve):
In [26]:
```
root = optimize.fsolve(f, 1) # 我们的最初猜想是1
root
```
Out[26]:
```
array([ 0.])
```
注意只找到一个根。检查`f`的图发现在-2.5左右还有应该有第二个根。通过调整我们最初的猜想,我们可以发现正确的值:
In [27]:
```
root2 = optimize.fsolve(f, -2.5)
root2
```
Out[27]:
```
array([-2.47948183])
```
**曲线拟合**
假设我们有来自`f`的样例数据,带有一些噪音:
In [28]:
```
xdata = np.linspace(-10, 10, num=20)
ydata = f(xdata) + np.random.randn(xdata.size)
```
现在,如果我们知道这些sample数据来自的函数(这个案例中是$x^2 + sin(x)$)的函数形式,而不知道每个数据项的系数,那么我们可以用最小二乘曲线拟合在找到这些系数。首先,我们需要定义函数来拟合:
In [29]:
```
def f2(x, a, b):
return a*x**2 + b*np.sin(x)
```
然后我们可以使用[scipy.optimize.curve_fit()](http://docs.scipy.org/doc/scipy/reference/generated/scipy.optimize.curve_fit.html#scipy.optimize.curve_fit)来找到`a`和`b`:
In [30]:
```
guess = [2, 2]
params, params_covariance = optimize.curve_fit(f2, xdata, ydata, guess)
params
```
Out[30]:
```
array([ 0.99719019, 10.27381534])
```
现在我们找到了`f`的最优解和根,并且用曲线去拟合它,我们将这些结果整合在一个图中:
[](http://scipy-lectures.github.io/plot_directive/pyplots/scipy_optimize_example2.py)
**注**:在Scipy >= 0.11中,包含所有最小值和寻找根的算法的统一接口:[scipy.optimize.minimize()](http://docs.scipy.org/doc/scipy/reference/generated/scipy.optimize.minimize.html#scipy.optimize.minimize)、 [scipy.optimize.minimize_scalar()](http://docs.scipy.org/doc/scipy/reference/generated/scipy.optimize.minimize_scalar.html#scipy.optimize.minimize_scalar)和 [scipy.optimize.root()](http://docs.scipy.org/doc/scipy/reference/generated/scipy.optimize.root.html#scipy.optimize.root)。他们允许通过`method`关键词容易的比较多种算法。
你可以在[scipy.optimize](http://docs.scipy.org/doc/scipy/reference/optimize.html#scipy.optimize)中找到对于多维度问题有相同功能的算法。
**练习:温度数据的曲线拟合**
下面是从1月开始阿拉斯加每个月的温度极值(摄氏度):
最大值: 17, 19, 21, 28, 33, 38, 37, 37, 31, 23, 19, 18
最小值: -62, -59, -56, -46, -32, -18, -9, -13, -25, -46, -52, -58
1. 绘制这些温度极值。
2. 定义一个函数,可以描述温度的最大值和最小值。提示:这个函数的周期是一年。提示:包含时间偏移。
3. 用[scipy.optimize.curve_fit()](http://docs.scipy.org/doc/scipy/reference/generated/scipy.optimize.curve_fit.html#scipy.optimize.curve_fit)拟合这个函数与数据。
4. 绘制结果。这个拟合合理吗?如果不合理,为什么?
5. 最低温度和最高温度的时间偏移是否与拟合一样精确?
**练习:2-D 最小值**
[](http://scipy-lectures.github.io/plot_directive/pyplots/scipy_optimize_sixhump.py)
六峰驼背函数: 
有多个全局和局部最低点。找到这个函数的全局最低点。
提示:
* 变量可以被限定在-2 < x < 2 和 -1 < y < 1。
* 用[numpy.meshgrid()](http://docs.scipy.org/doc/numpy/reference/generated/numpy.meshgrid.html#numpy.meshgrid) 和 pylab.imshow() 来从视觉上来寻找区域。
* [scipy.optimize.fmin_bfgs()](http://docs.scipy.org/doc/scipy/reference/generated/scipy.optimize.fmin_bfgs.html#scipy.optimize.fmin_bfgs) 或者另一个多维最小化。 多几个全局最小值,那些点上的函数值十多少?如果最初的猜测是$(x, y) = (0, 0)$会怎样?
看一下[非线性最小二乘曲线拟合:地形机载激光雷达数据中的点抽取](http://scipy-lectures.github.io/intro/summary-exercises/optimize-fit.html#summary-exercise-optimize)练习的总结,以及更高及的例子。
## 1.5.6\. 统计和随机数:[scipy.stats](http://docs.scipy.org/doc/scipy/reference/stats.html#scipy.stats)
[scipy.stats](http://docs.scipy.org/doc/scipy/reference/stats.html#scipy.stats)模块包含统计工具和随机过程的概率描述。在`numpy.random`中可以找到多个随机数生成器。
### 1.5.6.1 直方图和概率密度函数
给定随机过程的观察值,它们的直方图是随机过程的PDF(概率密度函数)的估计值:
In [31]:
```
a = np.random.normal(size=1000)
bins = np.arange(-4, 5)
bins
```
Out[31]:
```
array([-4, -3, -2, -1, 0, 1, 2, 3, 4])
```
In [32]:
```
histogram = np.histogram(a, bins=bins, normed=True)[0]
bins = 0.5*(bins[1:] + bins[:-1])
bins
```
Out[32]:
```
array([-3.5, -2.5, -1.5, -0.5, 0.5, 1.5, 2.5, 3.5])
```
In [35]:
```
from scipy import stats
import pylab as pl
b = stats.norm.pdf(bins) # norm 是一种分布
pl.plot(bins, histogram)
pl.plot(bins, b)
```
Out[35]:
```
[<matplotlib.lines.Line2D at 0x10764cd10>]
```
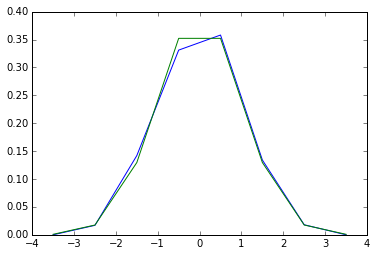
如果我们知道随机过程属于特定的随机过程家族,比如正态过程,我们可以做一个观察值的最大可能性拟合,来估计潜在分布的参数。这里我们用随机过程拟合观察数据:
In [5]:
```
loc, std = stats.norm.fit(a)
loc
```
Out[5]:
```
-0.063033073531050018
```
In [6]:
```
std
```
Out[6]:
```
0.97226620529973573
```
**练习:概率分布**
用shape参数为1的gamma分布生成1000个随机数,然后绘制那些样本的直方图。你可以在顶部绘制pdf(应该会匹配)吗?
额外信息:这些分布都有一些有用的方法。读一下文档字符串或者用IPython tab 完成来研究这些方法。你可以用在你的随机变量上使用`fit`方法来找回shape参数1吗?
### 1.5.6.2 百分位数
中数是有一半值在其上一半值在其下的值:
In [7]:
```
np.median(a)
```
Out[7]:
```
-0.061271835457024623
```
中数也被称为百分位数50,因为50%的观察值在它之下:
In [8]:
```
stats.scoreatpercentile(a, 50)
```
Out[8]:
```
-0.061271835457024623
```
同样,我们也能计算百分位数90:
In [10]:
```
stats.scoreatpercentile(a, 90)
```
Out[10]:
```
1.1746952490791494
```
百分位数是CDF的估计值:累积分布函数。
### 1.5.6.3 统计检验
统计检验是一个决策指示器。例如,如果我们有两组观察值,我们假设他们来自于高斯过程,我们可以用T检验来决定这两组观察值是不是显著不同:
In [11]:
```
a = np.random.normal(0, 1, size=100)
b = np.random.normal(1, 1, size=10)
stats.ttest_ind(a, b)
```
Out[11]:
```
(-2.8365663431591557, 0.0054465620169369703)
```
生成的结果由以下内容组成:
* T 统计值:一个值,符号与两个随机过程的差异成比例,大小与差异的程度有关。
* p 值:两个过程相同的概率。如果它接近1,那么这两个过程几乎肯定是相同的。越接近于0,越可能这两个过程有不同的平均数。
## 1.5.7 插值:[scipy.interpolate](http://docs.scipy.org/doc/scipy/reference/interpolate.html#scipy.interpolate)
[scipy.interpolate](http://docs.scipy.org/doc/scipy/reference/interpolate.html#scipy.interpolate)对从实验数据中拟合函数是非常有用的,因此,评估没有测量过的点。这个模块是基于[netlib](http://www.netlib.org/)项目的[Fortran子程序 FITPACK](http://www.netlib.org/dierckx/index.html)
假想一个接近sine函数的实验数据:
In [8]:
```
measured_time = np.linspace(0, 1, 10)
noise = (np.random.random(10)*2 - 1) * 1e-1
measures = np.sin(2 * np.pi * measured_time) + noise
```
[scipy.interpolate.interp1d](http://docs.scipy.org/doc/scipy/reference/generated/scipy.interpolate.interp1d.html#scipy.interpolate.interp1d)类可以建立一个线性插值函数:
In [9]:
```
from scipy.interpolate import interp1d
linear_interp = interp1d(measured_time, measures)
```
`scipy.interpolate.linear_interp`实例需要评估感兴趣的时间点:
In [10]:
```
computed_time = np.linspace(0, 1, 50)
linear_results = linear_interp(computed_time)
```
通过提供可选的参数`kind`也可以选择进行立方插值:
In [11]:
```
cubic_interp = interp1d(measured_time, measures, kind='cubic')
cubic_results = cubic_interp(computed_time)
```
现在结果可以被整合为下面的Matplotlib图片:
[](http://scipy-lectures.github.io/plot_directive/pyplots/scipy_interpolation.py)
[scipy.interpolate.interp2d](http://docs.scipy.org/doc/scipy/reference/generated/scipy.interpolate.interp2d.html#scipy.interpolate.interp2d) 与[scipy.interpolate.interp1d](http://docs.scipy.org/doc/scipy/reference/generated/scipy.interpolate.interp1d.html#scipy.interpolate.interp1d)类似,但是是用于2-D数组。注意对于`interp`家族,计算的时间点必须在测量时间段之内。看一下[Sprogø气象站的最大风速预测的总结练习](暂缺),了解更详细的spline插值实例。
## 1.5.8 数值积分:
[scipy.integrate.quad()](http://docs.scipy.org/doc/scipy/reference/generated/scipy.integrate.quad.html#scipy.integrate.quad)是最常见的积分程序:
In [1]:
```
from scipy.integrate import quad
res, err = quad(np.sin, 0, np.pi/2)
np.allclose(res, 1)
```
Out[1]:
```
True
```
In [2]:
```
np.allclose(err, 1 - res)
```
Out[2]:
```
True
```
其他的积分程序可以在`fixed_quad`、 `quadrature`、`romberg`中找到。
[scipy.integrate](http://docs.scipy.org/doc/scipy/reference/integrate.html#scipy.integrate) 可提供了常微分公式(ODE)的特色程序。特别的,[scipy.integrate.odeint()](http://docs.scipy.org/doc/scipy/reference/generated/scipy.integrate.odeint.html#scipy.integrate.odeint) 是使用LSODA(Livermore Solver for Ordinary Differential equations with Automatic method switching for stiff and non-stiff problems)的通用积分器,更多细节请见[ODEPACK Fortran 库](http://people.sc.fsu.edu/~jburkardt/f77_src/odepack/odepack.html)。
`odeint`解决如下形式的第一顺序ODE系统:
$dy/dt = rhs(y1, y2, .., t0,...)$
作为一个介绍,让我们解一下在初始条件下$y(t=0) = 1$,这个常微分公式$dy/dt = -2y$在$t = 0..4$时的值。首先,这个函数计算定义位置需要的导数:
In [3]:
```
def calc_derivative(ypos, time, counter_arr):
counter_arr += 1
return -2 * ypos
```
添加了一个额外的参数`counter_arr`用来说明这个函数可以在一个时间步骤被调用多次,直到收敛。计数器数组定义如下:
In [4]:
```
counter = np.zeros((1,), dtype=np.uint16)
```
现在计算轨迹线:
In [5]:
```
from scipy.integrate import odeint
time_vec = np.linspace(0, 4, 40)
yvec, info = odeint(calc_derivative, 1, time_vec,
args=(counter,), full_output=True)
```
因此,导数函数被调用了40多次(即时间步骤数):
In [6]:
```
counter
```
Out[6]:
```
array([129], dtype=uint16)
```
前十个时间步骤的累积循环数,可以用如下方式获得:
In [7]:
```
info['nfe'][:10]
```
Out[7]:
```
array([31, 35, 43, 49, 53, 57, 59, 63, 65, 69], dtype=int32)
```
注意,求解器对于首个时间步骤需要更多的循环。导数答案`yvec`可以画出来:
[](http://scipy-lectures.github.io/plot_directive/pyplots/odeint_introduction.py)
阻尼弹簧重物振子(二阶振荡器)是使用[scipy.integrate.odeint()](http://docs.scipy.org/doc/scipy/reference/generated/scipy.integrate.odeint.html#scipy.integrate.odeint)的另一个例子。链接到弹簧的重物的位置服从二阶常微分方程$y'' + 2 eps wo y' + wo^2 y = 0$,其中$wo^2 = k/m$ 弹簧的常数为k, m是重物质量,$eps=c/(2 m wo)$,c是阻尼系数。例如,我们选择如下参数:
In [8]:
```
mass = 0.5 # kg
kspring = 4 # N/m
cviscous = 0.4 # N s/m
```
因此系统将是欠阻尼的,因为:
In [9]:
```
eps = cviscous / (2 * mass * np.sqrt(kspring/mass))
eps < 1
```
Out[9]:
```
True
```
对于[scipy.integrate.odeint()](http://docs.scipy.org/doc/scipy/reference/generated/scipy.integrate.odeint.html#scipy.integrate.odeint)求解器,二阶等式需要被变换为系统内向量$Y=(y, y')$的两个一阶等式。为了方便,定义$nu = 2 eps * wo = c / m$和$om = wo^2 = k/m$:
In [10]:
```
nu_coef = cviscous / mass
om_coef = kspring / mass
```
因此函数将计算速度和加速度:
In [11]:
```
def calc_deri(yvec, time, nuc, omc):
return (yvec[1], -nuc * yvec[1] - omc * yvec[0])
time_vec = np.linspace(0, 10, 100)
yarr = odeint(calc_deri, (1, 0), time_vec, args=(nu_coef, om_coef))
```
如下的Matplotlib图片显示了最终的位置和速度: [](http://scipy-lectures.github.io/plot_directive/pyplots/odeint_damped_spring_mass.py)
在Sicpy中没有偏微分方程(PDE)求解器。存在其他求解PDE的Python包,比如[fipy](http://www.ctcms.nist.gov/fipy/)或[SfePy](http://code.google.com/p/sfepy/)。
## 1.5.9 信号处理:[scipy.signal](http://docs.scipy.org/doc/scipy/reference/signal.html#scipy.signal)
In [13]:
```
from scipy import signal
import matplotlib.pyplot as pl
```
* [scipy.signal.detrend()](http://docs.scipy.org/doc/scipy/reference/generated/scipy.signal.detrend.html#scipy.signal.detrend): 从信号中删除线性趋势:
In [14]:
```
t = np.linspace(0, 5, 100)
x = t + np.random.normal(size=100)
pl.plot(t, x, linewidth=3)
pl.plot(t, signal.detrend(x), linewidth=3)
```
Out[14]:
```
[<matplotlib.lines.Line2D at 0x10781e590>]
```
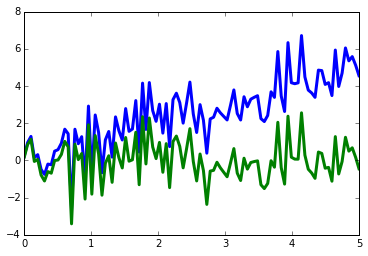
* [scipy.signal.resample()](http://docs.scipy.org/doc/scipy/reference/generated/scipy.signal.resample.html#scipy.signal.resample): 用FFT从信号中抽出n个点。
In [15]:
```
t = np.linspace(0, 5, 100)
x = np.sin(t)
pl.plot(t, x, linewidth=3)
pl.plot(t[::2], signal.resample(x, 50), 'ko')
```
Out[15]:
```
[<matplotlib.lines.Line2D at 0x107855cd0>]
```
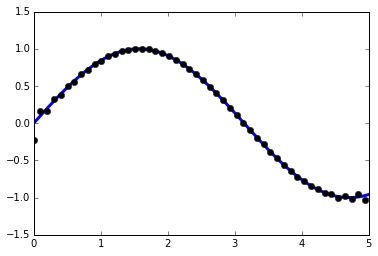
* [scipy.signal](http://docs.scipy.org/doc/scipy/reference/signal.html#scipy.signal) 有许多窗口函数:[scipy.signal.hamming()](http://docs.scipy.org/doc/scipy/reference/generated/scipy.signal.hamming.html#scipy.signal.hamming), [scipy.signal.bartlett()](http://docs.scipy.org/doc/scipy/reference/generated/scipy.signal.bartlett.html#scipy.signal.bartlett), [scipy.signal.blackman()](http://docs.scipy.org/doc/scipy/reference/generated/scipy.signal.blackman.html#scipy.signal.blackman)...
* [scipy.signal](http://docs.scipy.org/doc/scipy/reference/signal.html#scipy.signal) 有滤镜 (中位数滤镜[scipy.signal.medfilt()](http://docs.scipy.org/doc/scipy/reference/generated/scipy.signal.medfilt.html#scipy.signal.medfilt), Wiener[scipy.signal.wiener()](http://docs.scipy.org/doc/scipy/reference/generated/scipy.signal.wiener.html#scipy.signal.wiener)), 但是我们将在图片部分讨论这些。
## 1.5.10 图像处理:scipy.ndimage
scipy中专注于专注于图像处理的模块是scipy.ndimage。
In [18]:
```
from scipy import ndimage
```
图像处理程序可以根据他们进行的处理来分类。
### 1.5.10.1 图像的几何变换
改变原点,解析度,..
In [19]:
```
from scipy import misc
import matplotlib.pyplot as pl
lena = misc.lena()
shifted_lena = ndimage.shift(lena, (50, 50))
shifted_lena2 = ndimage.shift(lena, (50, 50), mode='nearest')
rotated_lena = ndimage.rotate(lena, 30)
cropped_lena = lena[50:-50, 50:-50]
zoomed_lena = ndimage.zoom(lena, 2)
zoomed_lena.shape
```
Out[19]:
```
(1024, 1024)
```

In [25]:
```
subplot(151)
pl.imshow(shifted_lena, cmap=cm.gray)
axis('off')
```
Out[25]:
```
(-0.5, 511.5, 511.5, -0.5)
```

### 1.5.10.2 图像滤波器
In [26]:
```
from scipy import misc
lena = misc.lena()
import numpy as np
noisy_lena = np.copy(lena).astype(np.float)
noisy_lena += lena.std()*0.5*np.random.standard_normal(lena.shape)
blurred_lena = ndimage.gaussian_filter(noisy_lena, sigma=3)
median_lena = ndimage.median_filter(blurred_lena, size=5)
from scipy import signal
wiener_lena = signal.wiener(blurred_lena, (5,5))
```
 在[scipy.ndimage.filters](http://docs.scipy.org/doc/scipy/reference/ndimage.html#scipy.ndimage.filters) 和 [scipy.signal](http://docs.scipy.org/doc/scipy/reference/signal.html#scipy.signal) 有更多应用于图像的滤波器。
练习
比较不同过滤后图像的条形图
### 1.5.10.3 数学形态学
数学形态学是集合理论分支出来的一个数学理论。它刻画并转换几何结构。特别是二元的图像(黑白)可以用这种理论来转换:被转换的集合是临近非零值像素的集合。这个理论也可以被扩展到灰度值图像。 
初级数学形态学操作使用结构化的元素,以便修改其他几何结构。
首先让我们生成一个结构化元素。
In [27]:
```
el = ndimage.generate_binary_structure(2, 1)
el
```
Out[27]:
```
array([[False, True, False],
[ True, True, True],
[False, True, False]], dtype=bool)
```
In [28]:
```
el.astype(np.int)
```
Out[28]:
```
array([[0, 1, 0],
[1, 1, 1],
[0, 1, 0]])
```
* 腐蚀
In [29]:
```
a = np.zeros((7,7), dtype=np.int)
a[1:6, 2:5] = 1
a
```
Out[29]:
```
array([[0, 0, 0, 0, 0, 0, 0],
[0, 0, 1, 1, 1, 0, 0],
[0, 0, 1, 1, 1, 0, 0],
[0, 0, 1, 1, 1, 0, 0],
[0, 0, 1, 1, 1, 0, 0],
[0, 0, 1, 1, 1, 0, 0],
[0, 0, 0, 0, 0, 0, 0]])
```
In [30]:
```
ndimage.binary_erosion(a).astype(a.dtype)
```
Out[30]:
```
array([[0, 0, 0, 0, 0, 0, 0],
[0, 0, 0, 0, 0, 0, 0],
[0, 0, 0, 1, 0, 0, 0],
[0, 0, 0, 1, 0, 0, 0],
[0, 0, 0, 1, 0, 0, 0],
[0, 0, 0, 0, 0, 0, 0],
[0, 0, 0, 0, 0, 0, 0]])
```
In [31]:
```
#腐蚀移除了比结构小的对象
ndimage.binary_erosion(a, structure=np.ones((5,5))).astype(a.dtype)
```
Out[31]:
```
array([[0, 0, 0, 0, 0, 0, 0],
[0, 0, 0, 0, 0, 0, 0],
[0, 0, 0, 0, 0, 0, 0],
[0, 0, 0, 0, 0, 0, 0],
[0, 0, 0, 0, 0, 0, 0],
[0, 0, 0, 0, 0, 0, 0],
[0, 0, 0, 0, 0, 0, 0]])
```
* 扩张
In [32]:
```
a = np.zeros((5, 5))
a[2, 2] = 1
a
```
Out[32]:
```
array([[ 0., 0., 0., 0., 0.],
[ 0., 0., 0., 0., 0.],
[ 0., 0., 1., 0., 0.],
[ 0., 0., 0., 0., 0.],
[ 0., 0., 0., 0., 0.]])
```
In [33]:
```
ndimage.binary_dilation(a).astype(a.dtype)
```
Out[33]:
```
array([[ 0., 0., 0., 0., 0.],
[ 0., 0., 1., 0., 0.],
[ 0., 1., 1., 1., 0.],
[ 0., 0., 1., 0., 0.],
[ 0., 0., 0., 0., 0.]])
```
* 开启
In [34]:
```
a = np.zeros((5,5), dtype=np.int)
a[1:4, 1:4] = 1; a[4, 4] = 1
a
```
Out[34]:
```
array([[0, 0, 0, 0, 0],
[0, 1, 1, 1, 0],
[0, 1, 1, 1, 0],
[0, 1, 1, 1, 0],
[0, 0, 0, 0, 1]])
```
In [35]:
```
# 开启移除了小对象
ndimage.binary_opening(a, structure=np.ones((3,3))).astype(np.int)
```
Out[35]:
```
array([[0, 0, 0, 0, 0],
[0, 1, 1, 1, 0],
[0, 1, 1, 1, 0],
[0, 1, 1, 1, 0],
[0, 0, 0, 0, 0]])
```
In [36]:
```
# 开启也可以平滑拐角
ndimage.binary_opening(a).astype(np.int)
```
Out[36]:
```
array([[0, 0, 0, 0, 0],
[0, 0, 1, 0, 0],
[0, 1, 1, 1, 0],
[0, 0, 1, 0, 0],
[0, 0, 0, 0, 0]])
```
* 闭合: `ndimage.binary_closing`
练习
验证一下开启相当于先腐蚀再扩张。
开启操作移除小的结构,而关闭操作填满了小洞。因此这些用来”清洗“图像。
In [37]:
```
a = np.zeros((50, 50))
a[10:-10, 10:-10] = 1
a += 0.25*np.random.standard_normal(a.shape)
mask = a>=0.5
opened_mask = ndimage.binary_opening(mask)
closed_mask = ndimage.binary_closing(opened_mask)
```

练习
验证一下重建的方格面积比原始方格的面积小。(如果关闭步骤在开启步骤之前则相反)。
对于_灰度值图像_,腐蚀(区别于扩张)相当于用感兴趣的像素周围的结构元素中的最小(区别于最大)值替换像素。
In [39]:
```
a = np.zeros((7,7), dtype=np.int)
a[1:6, 1:6] = 3
a[4,4] = 2; a[2,3] = 1
a
```
Out[39]:
```
array([[0, 0, 0, 0, 0, 0, 0],
[0, 3, 3, 3, 3, 3, 0],
[0, 3, 3, 1, 3, 3, 0],
[0, 3, 3, 3, 3, 3, 0],
[0, 3, 3, 3, 2, 3, 0],
[0, 3, 3, 3, 3, 3, 0],
[0, 0, 0, 0, 0, 0, 0]])
```
In [40]:
```
ndimage.grey_erosion(a, size=(3,3))
```
Out[40]:
```
array([[0, 0, 0, 0, 0, 0, 0],
[0, 0, 0, 0, 0, 0, 0],
[0, 0, 1, 1, 1, 0, 0],
[0, 0, 1, 1, 1, 0, 0],
[0, 0, 3, 2, 2, 0, 0],
[0, 0, 0, 0, 0, 0, 0],
[0, 0, 0, 0, 0, 0, 0]])
```
### 1.5.10.4 测量图像
首先让我们生成一个漂亮的人造二维图。
In [41]:
```
x, y = np.indices((100, 100))
sig = np.sin(2*np.pi*x/50.)*np.sin(2*np.pi*y/50.)*(1+x*y/50.**2)**2
mask = sig > 1
```
现在让我们看一下图像中对象的各种信息:
In [42]:
```
labels, nb = ndimage.label(mask)
nb
```
Out[42]:
```
8
```
In [43]:
```
areas = ndimage.sum(mask, labels, xrange(1, labels.max()+1))
areas
```
Out[43]:
```
array([ 190., 45., 424., 278., 459., 190., 549., 424.])
```
In [44]:
```
maxima = ndimage.maximum(sig, labels, xrange(1, labels.max()+1))
maxima
```
Out[44]:
```
array([ 1.80238238, 1.13527605, 5.51954079, 2.49611818,
6.71673619, 1.80238238, 16.76547217, 5.51954079])
```
In [45]:
```
ndimage.find_objects(labels==4)
```
Out[45]:
```
[(slice(30L, 48L, None), slice(30L, 48L, None))]
```
In [46]:
```
sl = ndimage.find_objects(labels==4)
import pylab as pl
pl.imshow(sig[sl[0]])
```
Out[46]:
```
<matplotlib.image.AxesImage at 0x10a861910>
```
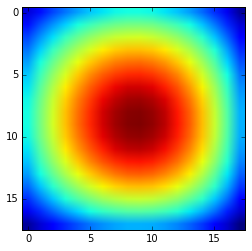

高级例子请看一下总结练习[图像处理应用:计数气泡和未融化的颗粒](http://scipy-lectures.github.io/intro/summary-exercises/image-processing.html#summary-exercise-image-processing)
## 1.5.11 科学计算的总结练习
总结练习主要使用Numpy、Scipy 和 Matplotlib。他们提供了一些使用Python进行科学计算的真实例子。现在,已经介绍了Numpy和Scipy的基本使用,邀请感兴趣的用户去做这些练习。
**练习:**
[1.5.11.13 Sprogø气象站的最大风速预测](http://scipy-lectures.github.io/intro/summary-exercises/stats-interpolate.html)
[1.5.11.14 非线性最小二乘曲线拟合:地形机载激光雷达数据中的点抽取](http://scipy-lectures.github.io/intro/summary-exercises/optimize-fit.html)
[1.5.11.15 图像处理应用:计数气泡和未融化的颗粒](http://scipy-lectures.github.io/intro/summary-exercises/image-processing.html)
**提议的解决方案:**
[1.5.11.16 图像处理练习:玻璃中的未融化颗粒的答案例子](http://scipy-lectures.github.io/intro/summary-exercises/answers_image_processing.html)
### 1.5.11.13 Sprogø气象站的最大风速预测
这个练习的目的是预测每50年的最大风速,即使在一个时间段内有记录。可用的数据只是位于丹麦的Sprogø气象站的21年的测量数据。首先,将给出统计步骤,接着将用scipy.interpolae模块中的函数来解释。在最后,将邀请感兴趣的读者用不同的方法从原始数据计算结果。
#### 1.5.11.13.1 统计方法
假设年度最大值符合正态概率密度函数。但是,这个函数不能用来预测,因为它从速度最大值中给出了概率。找到每50年的最大风速需要相反的方法,需要从确定的概率中找到结果。这是百分位数函数的作用而这个练习的目的是找到它。在当前的模型中,假设每50年出现的最大风速定义为高于2%百分位数。
根据定义,百分位数函数是累积分布函数的反函数。后者描述了年度最大值的概率分布。在这个练习中,给定年份$i$的累积概率$p_i$被定义为$p_i = i/(N+1)$,其中$N = 21$,测量的年数。因此,计算每个测量过的风速最大值的累积概率是可以行的。从这些实验点,scipy.interpolate模块将对拟合百分位数函数非常有用。最后,50年的最大值将从累积概率的2%百分位数中预估出来。
#### 1.5.11.13.2 计算累积概率
计算好的numpy格式的年度风速最大值存储在[examples/max-speeds.npy](http://scipy-lectures.github.io/_downloads/max-speeds.npy)文件中, 因此,可以用numpy加载:
In [4]:
```
import numpy as np
max_speeds = np.load('data/max-speeds.npy')
years_nb = max_speeds.shape[0]
```
下面是前面板块的累积概率定义$p_i$,对应值将为:
In [5]:
```
cprob = (np.arange(years_nb, dtype=np.float32) + 1)/(years_nb + 1)
```
并且假设他们可以拟合给定的风速:
In [6]:
```
sorted_max_speeds = np.sort(max_speeds)
```
#### 1.5.11.13.3 用UnivariateSpline预测
在这个部分,百分位数函数将用`UnivariateSpline`类来估计,这个类用点代表样条。 默认行为是构建一个3度的样条,不同的点根据他们的可靠性可能有不同的权重。相关的变体还有`InterpolatedUnivariateSpline`和`LSQUnivariateSpline`,差别在于检查误差的方式不同。如果需要2D样条,可以使用`BivariateSpline`家族类。所有这些1D和2D样条使用FITPACK Fortran 程序,这就是为什么通过`splrep`和`splev`函数来表征和评估样条的库更少。同时,不使用FITPACK参数的插值函数也提供更简便的用法(见`interp1d`, `interp2d`, `barycentric_interpolate`等等)。 对于Sprogø最大风速的例子,将使用`UnivariateSpline`,因为3度的样条似乎可以正确拟合数据:
In [7]:
```
from scipy.interpolate import UnivariateSpline
quantile_func = UnivariateSpline(cprob, sorted_max_speeds)
```
百分位数函数将用评估来所有范围的概率:
In [8]:
```
nprob = np.linspace(0, 1, 1e2)
fitted_max_speeds = quantile_func(nprob)
```
在当前的模型中,每50年出现的最大风速被定义为大于2%百分位数。作为结果,累积概率值将是:
In [9]:
```
fifty_prob = 1. - 0.02
```
因此,可以猜测50年一遇的暴风雪风速为:
In [10]:
```
fifty_wind = quantile_func(fifty_prob)
fifty_wind
```
Out[10]:
```
array(32.97989825386221)
```
现在,结果被收集在Matplotlib图片中:

答案:[Python源文件](http://scipy-lectures.github.io/intro/summary-exercises/auto_examples/plot_cumulative_wind_speed_prediction.html#example-plot-cumulative-wind-speed-prediction-py)
#### 1.5.11.13.4 Gumbell分布练习
现在邀请感兴趣的读者用21年测量的风速做一个练习。测量区间为90分钟(原始的区间约为10分钟,但是,为了让练习的设置简单一些,缩小了文件的大小)。数据以numpy格式存储在文件[examples/sprog-windspeeds.npy](http://scipy-lectures.github.io/_downloads/sprog-windspeeds.npy)中。 在完成练习后,不要看绘图的源代码。
* 第一步将是通过使用numpy来找到年度最大值,然后将它们绘制为matplotlibe条形图。 
答案:[Python源文件](http://scipy-lectures.github.io/intro/summary-exercises/auto_examples/plot_sprog_annual_maxima.html#example-plot-sprog-annual-maxima-py)
* 第二步将是在累积概率$p_i$使用Gumbell分布,$p_i$的定义是$-log( -log(p_i) )$用来拟合线性百分位数函数(记住你可以定义UnivariateSpline的度数)。 绘制年度最大值和Gumbell分布将生产如下图片。

答案:[Python源文件](http://scipy-lectures.github.io/intro/summary-exercises/auto_examples/plot_gumbell_wind_speed_prediction.html#example-plot-gumbell-wind-speed-prediction-py)
* 最后一步将是找到在每50年出现的最大风速34.23 m/s。
### 1.5.11.14 非线性最小二乘曲线拟合:地理雷达数据中的点抽取应用
这个练习的目的是用模型去拟合一些数据。这篇教程中的数据是雷达数据,下面的介绍段落将详细介绍。如果你没有耐心,想要马上进行联系,那么请跳过这部分,并直接进入[加载和可视化](http://scipy-lectures.github.io/intro/summary-exercises/optimize-fit.html#first-step)。
#### 1.5.11.14.1 介绍
雷达系统是光学测距仪,通过分析离散光的属性来测量距离。绝大多数光学测距仪向目标发射一段短光学脉冲,然后记录反射信号。然后处理这个信号来抽取雷达系统与目标间的距离。
地形雷达系统是嵌入在飞行平台的雷达系统。它们测量平台与地球的距离,以便计算出地球的地形信息(更多细节见[[1]](http://scipy-lectures.github.io/intro/summary-exercises/optimize-fit.html#mallet))。
[1] Mallet, C. and Bretar, F. Full-Waveform Topographic Lidar: State-of-the-Art. ISPRS Journal of Photogrammetry and Remote Sensing 64(1), pp.1-16, January 2009 [http://dx.doi.org/10.1016/j.isprsjprs.2008.09.007](http://dx.doi.org/10.1016/j.isprsjprs.2008.09.007)
这篇教程的目的是分析雷达系统记录到的波形数据[[2]](http://scipy-lectures.github.io/intro/summary-exercises/optimize-fit.html#data)。这种信号包含波峰,波峰的中心和振幅可以用来计算命中目标的位置和一些特性。当激光柱的脚步距离地球表面1m左右,光柱可以在二次传播时击中多个目标(例如,地面和树木或建筑的顶部)。激光柱的击中每个目标的贡献之和会产生一个有多个波峰的复杂波,每一个包含一个目标的信息。
一种从这些数据中抽取信息的先进方法是在一个高斯函数和中分解这些信息,每个函数代表激光柱击中的一个目标的贡献。
因此,我们使用`the scipy.optimize`模块将波形拟合为一个高斯函数或高斯函数之和。
#### 1.5.11.14.2 加载和可视化
加载第一个波形:
In [1]:
```
import numpy as np
waveform_1 = np.load('data/waveform_1.npy')
```
接着可视化:
In [2]:
```
import matplotlib.pyplot as plt
t = np.arange(len(waveform_1))
plt.plot(t, waveform_1)
plt.show()
```
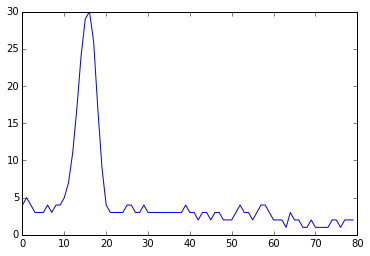
你可以注意到,这个波形是单峰80个区间的信息。
#### 1.5.11.14.3 用简单的高斯模型拟合波形
这个信号非常简单,可以被建模为一个高斯函数,抵消相应的背景噪音。要用函数拟合这个信号,我们必须:
* 定义一个模型
* 给出初始解
* 调用`scipy.optimize.leastsq`
##### 1.5.11.14.3.1 模型
高斯函数定义如下:
$B + A \exp\left\{-\left(\frac{t-\mu}{\sigma}\right)^2\right\}$
在Python中定义如下:
In [3]:
```
def model(t, coeffs):
return coeffs[0] + coeffs[1] * np.exp( - ((t-coeffs[2])/coeffs[3])**2 )
```
其中
* coeffs[0] is $B$ (noise)
* coeffs[1] is $A$ (amplitude)
* coeffs[2] is $\mu$ (center)
* coeffs[3] is $\sigma$ (width)
##### 1.5.11.14.3.2 初始解
通过观察图形,我们可以找到大概的初始解,例如:
In [5]:
```
x0 = np.array([3, 30, 15, 1], dtype=float)
```
##### 1.5.11.14.3.3 拟合
`scipy.optimize.leastsq`最小化作为参数给到的函数的平方和。本质上来说,函数最小化的是残差(数据与模型的差异):
In [6]:
```
def residuals(coeffs, y, t):
return y - model(t, coeffs)
```
因此,让我们通过下列参数调用`scipy.optimize.leastsq`来求解:
* 最小化的函数
* 初始解
* 传递给函数的额外参数
In [7]:
```
from scipy.optimize import leastsq
x, flag = leastsq(residuals, x0, args=(waveform_1, t))
print x
```
```
[ 2.70363341 27.82020741 15.47924562 3.05636228]
```
答案可视化:
In [8]:
```
plt.plot(t, waveform_1, t, model(t, x))
plt.legend(['waveform', 'model'])
plt.show()
```
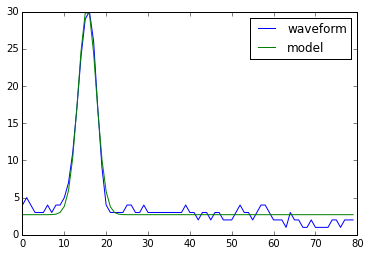
备注:从scipy v0.8及以上,你应该使用`scipy.optimize.curve_fit`,它使用模型和数据作为参数,因此,你不再需要定义残差。
#### 1.5.11.14.4 更进一步
* 试一下包含三个波峰的更复杂波形(例如[data/waveform_2.npy](https://github.com/scipy-lectures/scipy-lecture-notes/raw/master/data/waveform_2.npy))。你必须调整模型,现在它是高斯函数之和,而不是只有一个高斯波峰。

* 在一些情况下,写一个函数来计算Jacobian,要比让leastsq从数值上估计它来的快。创建一个函数来计算残差的Jacobian,并且用它作为leastsq的一个输入。
* 当我们想要识别信号中非常小的峰值,或者初始的猜测离好的解决方案太远时,算法给出的结果往往不能令人满意。为模型参数添加限制可以确保克服这些局限性。我们可以添加的先前经验是变量的符号(都是正的)。
用下列初始解:
In [9]:
```
x0 = np.array([3, 50, 20, 1], dtype=float)
```
添加了边界限制之后比较一下`scipy.optimize.leastsq`与`scipy.optimize.fmin_slsqp`的结果。
[2] 本教程的数据部分来自于[FullAnalyze software](http://fullanalyze.sourceforge.net/)的演示数据,由 [GIS DRAIX](http://www.ore.fr/rubrique.php3?id_rubrique=24) 友情提供。
### 1.5.11.15 图像处理应用:计数气泡和未融化的颗粒
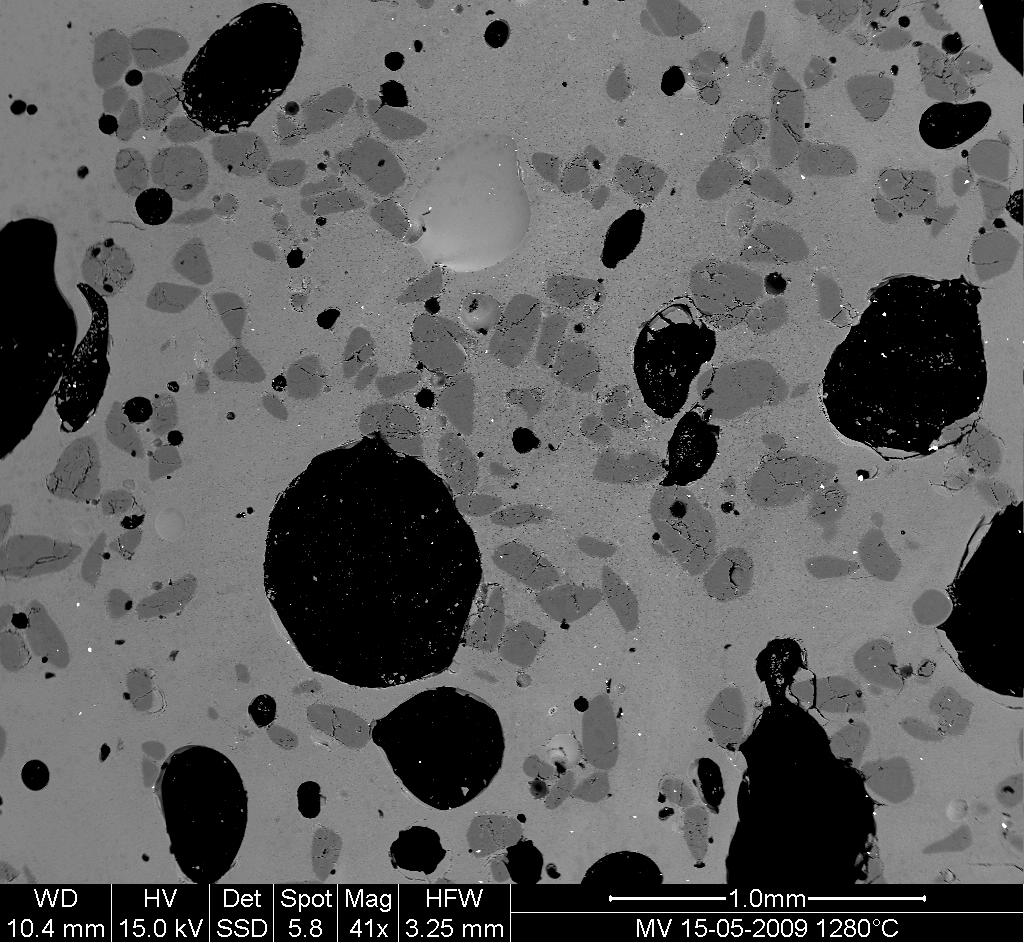
#### 1.5.11.15.1 问题描述
1. 打开图像文件MV_HFV_012.jpg并且浏览一下。看一下imshow文档字符串中的参数,用“右”对齐来显示图片(原点在左下角,而不是像标准数组在右上角)。
这个扫描元素显微图显示了一个带有一些气泡(黑色)和未溶解沙(深灰)的玻璃样本(轻灰矩阵)。我们想要判断样本由三个状态覆盖的百分比,并且预测沙粒和气泡的典型大小和他们的大小等。
2. 修建图片,删除带有测量信息中底部面板。
3. 用中位数过滤稍稍过滤一下图像以便改进它的直方图。看一下直方图的变化。
4. 使用过滤后图像的直方图,决定允许定义沙粒像素,玻璃像素和气泡像素掩蔽的阈限。其他的选项(家庭作业):写一个函数从直方图的最小值自动判断阈限。
5. 将三种不同的相用不同的颜色上色并显示图片。
6. 用数学形态学清理不同的相。
7. 为所有气泡和沙粒做标签,从沙粒中删除小于10像素的掩蔽。要这样做,用`ndimage.sum`或`np.bincount`来计算沙粒大小。
8. 计算气泡的平均大小。
### 1.5.11.16 图像处理练习:玻璃中的未融化颗粒的答案例子
In [1]:
```
import numpy as np
import pylab as pl
from scipy import ndimage
```

* 打开图像文件MV_HFV_012.jpg并且浏览一下。看一下imshow文档字符串中的参数,用“右”对齐来显示图片(原点在左下角,而不是像标准数组在右上角)。
In [3]:
```
dat = pl.imread('data/MV_HFV_012.jpg')
```
* 修建图片,删除带有测量信息中底部面板。
In [4]:
```
dat = dat[60:]
```
* 用中位数过滤稍稍过滤一下图像以便改进它的直方图。看一下直方图的变化。
In [5]:
```
filtdat = ndimage.median_filter(dat, size=(7,7))
hi_dat = np.histogram(dat, bins=np.arange(256))
hi_filtdat = np.histogram(filtdat, bins=np.arange(256))
```
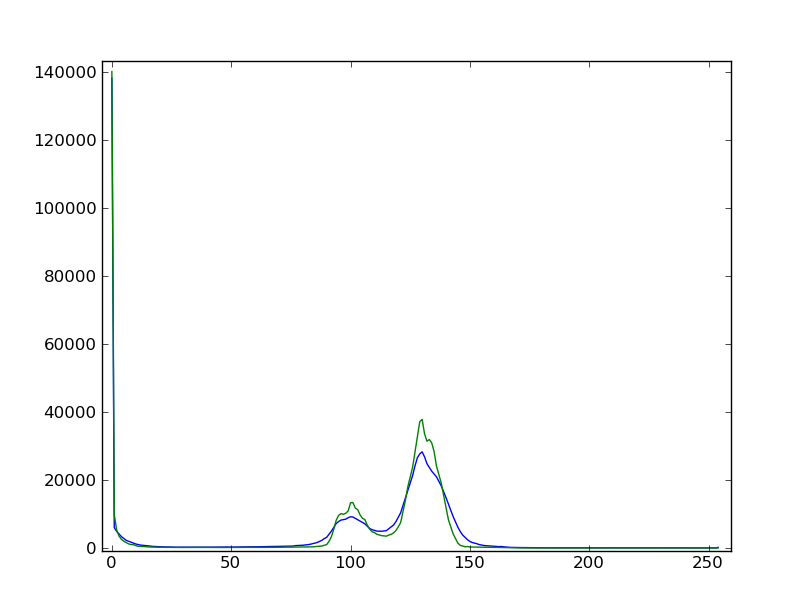
* 使用过滤后图像的直方图,决定允许定义沙粒像素,玻璃像素和气泡像素掩蔽的阈限。其他的选项(家庭作业):写一个函数从直方图的最小值自动判断阈限。
In [6]:
```
void = filtdat <= 50
sand = np.logical_and(filtdat > 50, filtdat <= 114)
glass = filtdat > 114
```
* 将三种不同的相用不同的颜色上色并显示图片。
In [7]:
```
phases = void.astype(np.int) + 2*glass.astype(np.int) + 3*sand.astype(np.int)
```
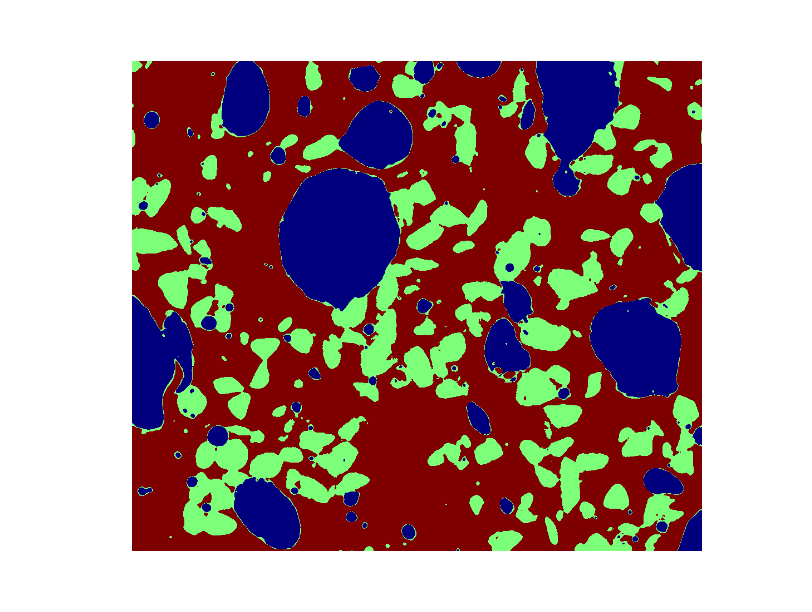
* 用数学形态学清理不同的相。
In [8]:
```
sand_op = ndimage.binary_opening(sand, iterations=2)
```
* 为所有气泡和沙粒做标签,从沙粒中删除小于10像素的掩蔽。要这样做,用`ndimage.sum`或`np.bincount`来计算沙粒大小。
In [9]:
```
sand_labels, sand_nb = ndimage.label(sand_op)
sand_areas = np.array(ndimage.sum(sand_op, sand_labels, np.arange(sand_labels.max()+1)))
mask = sand_areas > 100
remove_small_sand = mask[sand_labels.ravel()].reshape(sand_labels.shape)
```

* 计算气泡的平均大小。
In [10]:
```
bubbles_labels, bubbles_nb = ndimage.label(void)
bubbles_areas = np.bincount(bubbles_labels.ravel())[1:]
mean_bubble_size = bubbles_areas.mean()
median_bubble_size = np.median(bubbles_areas)
mean_bubble_size, median_bubble_size
```
Out[10]:
```
(2416.863157894737, 60.0)
```
1.4 Matplotlib:绘图
最后更新于:2022-04-01 11:21:31
# 1.4 Matplotlib:绘图
## 1.4.1 简介
[Matplotlib](http://matplotlib.org/) 可能是Python惟一一个最广泛使用的二维图包。它同时提供了从Python中可视化数据非常的快速方式以及多种格式的出版质量图片。我们将在交互模式下研究Matplotlib,包含大多数的常用案例。
### 1.4.1.1 IPython和pylab模式
[IPython](http://ipython.org/)是强化版交互Python shell,有许多有趣的功能,包括:输入输出的命名、访问shell命令改进错误排除等。它位于Python中的科学计算工作流的核心,要让它与Matplotlib的结合使用:
用命令行参数 `-pylab`(`--pylab` 从IPython0.12开始)启动IPython,获得带有Matlab/Mathematica类似功能的交互Matplotlib session。
### 1.4.1.2 pylab
_pylab_提供了matplotlib面向对象的绘图库的程序接口。它的模型与Matlab™非常相近。因此,pylab中的绝大多数绘图命令Matlab™都有带有相似函数的类似实现。重要的命令会以交互例子来解释。
## 1.4.2 简单绘图
在这个部分,我们将在同一个图像中绘制cosine和sine函数。从默认设置开始,我们将不断丰富图片,让它看起来更漂亮。
第一步获得sine和cosine函数的数据:
In [2]:
```
import numpy as np
X = np.linspace(-np.pi, np.pi, 256, endpoint=True)
C, S = np.cos(X), np.sin(X)
```
`X`现在是Numpy数组,范围是`-π`到`+π`之间(包含)的256个值。C是cosine(256个值),而S是sine(256个值)
要运行例子,你可以在IPython的交互session中输入这些命令:
```
ipython --pylab
```
这会将我们带到IPython提示符:
```
IPython 2.3.1 -- An enhanced Interactive Python.
? -> Introduction and overview of IPython's features.
%quickref -> Quick reference.
help -> Python's own help system.
object? -> Details about 'object', use 'object??' for extra details.
Using matplotlib backend: MacOSX
```
你可以下载每个示例,然后用平常的Python运行,但是,你将没法动态的数据操作:
```
python exercice_1.py
```
通过点击对应的图片,你可以获得每一步的源码。
### 1.4.2.1 用默认设置绘图
**提示**:文档
* [plot教程](http://matplotlib.sourceforge.net/users/pyplot_tutorial.html)
* [plot()命令](http://matplotlib.sourceforge.net/api/pyplot_api.html#matplotlib.pyplot.plot)
Matplotlib有一组默认设置,允许自定义所有的属性。你几乎可以控制在matplotlib中的所有属性:图片大小和dpi、线长度、颜色和样式、坐标轴、坐标轴和网格属性、文本和字体属性等等。
```
import pylab as pl
import numpy as np
X = np.linspace(-np.pi, np.pi, 256, endpoint=True)
C, S = np.cos(X), np.sin(X)
pl.plot(X, C)
pl.plot(X, S)
pl.show()
```
[](http://scipy-lectures.github.io/intro/matplotlib/auto_examples/plot_exercice_1.html)
### 1.4.2.2 默认值示例
**提示**:文档
* [自定义matplotlib](http://matplotlib.sourceforge.net/users/customizing.html)
在下面的脚本中,我们标示(备注)了影响绘图外观的所有图片设置。
这些设置被显式的设置为默认值,但是现在你可以交互的实验这些值以便验证他们的效果(看一下下面的[线属性](http://scipy-lectures.github.io/intro/matplotlib/matplotlib.html#line-properties)和[线样式](http://scipy-lectures.github.io/intro/matplotlib/matplotlib.html#line-styles))。
```
import pylab as pl
import numpy as np
# 创建一个大小为 8X6 英寸,每英寸80个点的图片
pl.figure(figsize=(8, 6), dpi=80)
# 从1X1的网格创建一个子图片
pl.subplot(1, 1, 1)
X = np.linspace(-np.pi, np.pi, 256, endpoint=True)
C, S = np.cos(X), np.sin(X)
# 用宽度为1(像素)的蓝色连续直线绘制cosine
pl.plot(X, C, color="blue", linewidth=1.0, linestyle="-")
# 用宽度为1(像素)的绿色连续直线绘制sine
pl.plot(X, S, color="green", linewidth=1.0, linestyle="-")
# 设置x轴的极值
pl.xlim(-4.0, 4.0)
# 设置x轴的刻度值
pl.xticks(np.linspace(-4, 4, 9, endpoint=True))
# 设置y轴的极值
pl.ylim(-1.0, 1.0)
# 设置y轴的刻度值
pl.yticks(np.linspace(-1, 1, 5, endpoint=True))
# 用72dpi保存图片
# savefig("exercice_2.png", dpi=72)
# 在屏幕上显示结果
pl.show()
```
[](http://scipy-lectures.github.io/intro/matplotlib/auto_examples/plot_exercice_2.html)
### 1.4.2.3 改变颜色和线宽度
**提示**:文档
* [控制线属性](http://matplotlib.sourceforge.net/users/pyplot_tutorial.html#controlling-line-properties)
* [线API](http://matplotlib.sourceforge.net/api/artist_api.html#matplotlib.lines.Line2D)
首先,我们想要cosine是蓝色,sine是红色,两者都是稍稍粗一点的线。我们也改变了一点图片的大小,让它更加水平。
```
pl.figure(figsize=(10, 6), dpi=80)
pl.plot(X, C, color="blue", linewidth=2.5, linestyle="-")
pl.plot(X, S, color="red", linewidth=2.5, linestyle="-")
```
[](http://scipy-lectures.github.io/intro/matplotlib/auto_examples/plot_exercice_3.html)
### 1.4.2.4 设置极值
**提示**:文档
* [xlim()命令](http://matplotlib.sourceforge.net/api/pyplot_api.html#matplotlib.pyplot.xlim)
* [ylim()命令](http://matplotlib.sourceforge.net/api/pyplot_api.html#matplotlib.pyplot.ylim)
当前的图片的极值限制太拥挤了,我们希望留一点空间以便清晰的看到所有的数据点。
```
pl.xlim(X.min() * 1.1, X.max() * 1.1)
pl.ylim(C.min() * 1.1, C.max() * 1.1)
```
[](http://scipy-lectures.github.io/intro/matplotlib/auto_examples/plot_exercice_4.html)
### 1.4.2.5 设置坐标轴刻度值
**提示**:文档
* [xticks()命令](http://matplotlib.sourceforge.net/api/pyplot_api.html#matplotlib.pyplot.xticks)
* [yticks()命令](http://matplotlib.sourceforge.net/api/pyplot_api.html#matplotlib.pyplot.yticks)
* [刻度容器](http://matplotlib.sourceforge.net/users/artists.html#axis-container)
* [刻度位置和格式](http://matplotlib.sourceforge.net/api/ticker_api.html)
现在的刻度不太理想,因为他们没有显示对于sine和cosine有意义的值(+/-π,+/-π/2)。我们将改变这些刻度,让他们只显示这些值。
```
pl.xticks([-np.pi, -np.pi/2, 0, np.pi/2, np.pi])
pl.yticks([-1, 0, +1])
```
[](http://scipy-lectures.github.io/intro/matplotlib/auto_examples/plot_exercice_5.html)
### 1.4.2.6 设置刻度标签
**提示**:文档
* [操作文本](http://matplotlib.sourceforge.net/users/index_text.html)
* [xticks()命令](http://matplotlib.sourceforge.net/api/pyplot_api.html#matplotlib.pyplot.xticks)
* [yticks()命令](http://matplotlib.sourceforge.net/api/pyplot_api.html#matplotlib.pyplot.yticks)
* [set_xticklabels()](http://matplotlib.sourceforge.net/api/axes_api.html?#matplotlib.axes.Axes.set_xticklabels)
* [set_yticklabels()](http://matplotlib.sourceforge.net/api/axes_api.html?#matplotlib.axes.Axes.set_yticklabels)
刻度现在放在了正确的位置,但是标签并不是显而易见。我们能想到3.14是π,但是最好让它更明确。
当我们设置了刻度值,我们也可以在第二个参数中列出对应的标签。注意我们用latex以便更好的渲染标签。
```
pl.xticks([-np.pi, -np.pi/2, 0, np.pi/2, np.pi],
[r'$-\pi$', r'$-\pi/2$', r'$0$', r'$+\pi/2$', r'$+\pi$'])
pl.yticks([-1, 0, +1],
[r'$-1$', r'$0$', r'$+1$'])
```
### 1.4.2.7 移动脊柱
**提示**:文档
* [脊柱](http://matplotlib.sourceforge.net/api/spines_api.html#matplotlib.spines)
* [坐标轴容器](http://matplotlib.sourceforge.net/users/artists.html#axis-container)
* [转换教程](http://matplotlib.sourceforge.net/users/transforms_tutorial.html)
脊柱是连接坐标轴刻度标记的线,记录了数据范围的边界。他们可以被放在任意的位置,到目前位置,他们被放在了坐标轴的四周。我们将改变他们,因为我们希望他们在中间。因为有四条(上下左右),我们通过设置颜色为None舍弃了顶部和右侧,并且我们将把底部和左侧的脊柱移动到数据空间坐标的零点。
```
ax = pl.gca() # gca stands for 'get current axis'
ax.spines['right'].set_color('none')
ax.spines['top'].set_color('none')
ax.xaxis.set_ticks_position('bottom')
ax.spines['bottom'].set_position(('data',0))
ax.yaxis.set_ticks_position('left')
ax.spines['left'].set_position(('data',0))
```
[](http://scipy-lectures.github.io/intro/matplotlib/auto_examples/plot_exercice_7.html)
### 1.4.2.8 添加图例
**提示**:文档
* [图例指南](http://matplotlib.sourceforge.net/users/legend_guide.html)
* [legend()命令](http://matplotlib.sourceforge.net/api/pyplot_api.html#matplotlib.pyplot.legend)
* [图例API](http://matplotlib.sourceforge.net/api/legend_api.html#matplotlib.legend.Legend)
让我们在坐上角添加图例。这只需要在plot命里中添加关键词参数label(将被用于图例框)。
```
pl.plot(X, C, color="blue", linewidth=2.5, linestyle="-", label="cosine")
pl.plot(X, S, color="red", linewidth=2.5, linestyle="-", label="sine")
pl.legend(loc='upper left')
```
[](http://scipy-lectures.github.io/intro/matplotlib/auto_examples/plot_exercice_8.html)
### 1.4.2.9 标注一些点
**提示**:文档
* [注释坐标轴](http://matplotlib.sourceforge.net/users/annotations_guide.html)
* [annotate()命令](http://matplotlib.sourceforge.net/api/pyplot_api.html#matplotlib.pyplot.annotate)
让我们用annotate命令标注一些有趣的点。我们选取值2π/3,我们想要标注sine和cosine。首先我们在曲线上画出了一个垂直的散点标记线。然后,我们将用annotate命令显示带有剪头的文字。
```
t = 2 * np.pi / 3
pl.plot([t, t], [0, np.cos(t)], color='blue', linewidth=2.5, linestyle="--")
pl.scatter([t, ], [np.cos(t), ], 50, color='blue')
pl.annotate(r'$sin(\frac{2\pi}{3})=\frac{\sqrt{3}}{2}$',
xy=(t, np.sin(t)), xycoords='data',
xytext=(+10, +30), textcoords='offset points', fontsize=16,
arrowprops=dict(arrowstyle="->", connectionstyle="arc3,rad=.2"))
pl.plot([t, t],[0, np.sin(t)], color='red', linewidth=2.5, linestyle="--")
pl.scatter([t, ],[np.sin(t), ], 50, color='red')
pl.annotate(r'$cos(\frac{2\pi}{3})=-\frac{1}{2}$',
xy=(t, np.cos(t)), xycoords='data',
xytext=(-90, -50), textcoords='offset points', fontsize=16,
arrowprops=dict(arrowstyle="->", connectionstyle="arc3,rad=.2"))
```
[](http://scipy-lectures.github.io/intro/matplotlib/auto_examples/plot_exercice_9.html)
### 1.4.2.10 细节是魔鬼
**提示**:文档
* [Artists](http://matplotlib.sourceforge.net/api/artist_api.html)
* [BBox](http://matplotlib.sourceforge.net/api/artist_api.html#matplotlib.text.Text.set_bbox)
因为蓝色和红色的线,刻度标签很难看到。我们可以让他们更大一些,也可以调整他们的属性以便他们被处理为半透明的白色背景。这样我们就可以同时看到数据和标签。
```
for label in ax.get_xticklabels() + ax.get_yticklabels():
label.set_fontsize(16)
label.set_bbox(dict(facecolor='white', edgecolor='None', alpha=0.65))
```
[](http://scipy-lectures.github.io/intro/auto_examples/plot_exercice_10.html)
## 1.4.3 图形、子图、轴和刻度
在matplotlib中“**图形**”是用户界面中的整个窗口。在这个图形中可以有“**子图**”。
到目前为止,我们已经使用图形和创建数轴。这对于快速绘图是非常方便的。使用图形、子图和轴我们可以控制显示。尽管子图将图表放在标准的网格中,轴可以在图形中放在任意位置。根据你的目的不同,二者都非常有用。我们也在没有显式的调用图形和子图时使用了他们。当我们调用plot时,matplotlib调用`gca()`来获得当前的坐标轴,相应的调用`gcf()`获得当前的图形。如果没有当前图形,那么将调用`figure()`去创建一个,严格来说是创建一个`subplot(111)。让我们来详细看一下。
### 1.4.3.1 图形
图形是在GUI中的窗口,标题是"Figure #"。图形的标号从1开始,而不是常规的Python方式从0开始。这明显是MATLAB-风格。这些参数决定图形的外观:
| 参数 | 默认值 | 描述 |
| --- | --- | --- |
| num | 1 | 图形编号 |
| figsize | figure.figsize | 以英寸表示的图形大小(宽、高) |
| dpi | figure.dpi | 分辨率以每英寸点数表示 |
| facecolor | figure.facecolor | 背景色 |
| edgecolor | figure.edgecolor | 背景边缘色 |
| frameon | True | 是否绘制框架 |
默认值可以在资源文件中指明,并在绝大数时间使用。只有图形数经常被改变。
与其他对象类似,你可以用setp或者set_something方法设置图形属性。
当你使用GUI工作时,你可以点击右上的X关闭图形。但是,你可以通过调用close用程序关闭图形。根据参数关闭不同内容(1)当前图形(没有参数),(2)特定图形(用图形编号或图形实例做参数),(3)所有图形("all"作为参数)。
```
pl.close(1) # Closes figure 1
```
### 1.4.3.2 子图
用子图你可以将图片放置在标准方格中。你需要指定行列数和图片数。 注意[gridspec](http://matplotlib.org/users/gridspec.html)命令相对更加高级。
[](http://scipy-lectures.github.io/intro/auto_examples/plot_subplot-horizontal.html)[](http://scipy-lectures.github.io/intro/auto_examples/plot_subplot-vertical.html)[](http://scipy-lectures.github.io/intro/auto_examples/plot_subplot-grid.html)[](http://scipy-lectures.github.io/intro/auto_examples/plot_gridspec.html)
### 1.4.3.3 轴
轴与子图非常类似,不过允许图形放在图片的任意位置。因此,如果我们想要将一个小图形放在一个更大图形中,我们可以用轴。
[](http://scipy-lectures.github.io/intro/auto_examples/plot_axes.html)[](http://scipy-lectures.github.io/intro/auto_examples/plot_axes-2.html)
### 1.4.3.4 刻度
格式良好的刻度是准备好发布图片的必要部分。Matplotlib提供了一个完全可控的刻度系统。有刻度位置来指定刻度该出现在哪,还有刻度格式来给出你想要的刻度外观。主刻度和子刻度可以被独立放置和整理格式。之前子刻度默认是不显示的,即他们只有空列表,因为它是`NullLocator` (见下面)。
#### 1.4.3.4.1 刻度位置
刻度位置可以控制的位置。它的设置如下:
```
ax = pl.gca()
ax.xaxis.set_major_locator(eval(locator))
```
不同的需求有多种位置:
[](http://scipy-lectures.github.io/intro/auto_examples/plot_ticks.html)
所有这些位置都可以从基础类[matplotlib.ticker.Locator](http://matplotlib.org/api/ticker_api.html#matplotlib.ticker.Locator)衍生出来。你可以从中衍生出你自己的位置。将日期处理为刻度特别困哪。因此,`matplotlib`提供了特殊的位置`matplotlib.dates`。
## 1.4.4 其他类型的图形:例子与练习
### 1.4.4.1 常规图形
**提示:**你可以使用[fill_between](http://matplotlib.sourceforge.net/api/pyplot_api.html#matplotlib.pyplot.fill_between)命令。
[](http://scipy-lectures.github.io/intro/auto_examples/plot_plot_ex.html)
从下面的代码开始,试着重新生成这个图片,小心处理填充区域:
```
n = 256
X = np.linspace(-np.pi, np.pi, n, endpoint=True)
Y = np.sin(2 * X)
pl.plot(X, Y + 1, color='blue', alpha=1.00)
pl.plot(X, Y - 1, color='blue', alpha=1.00)
```
点击图片查看答案。
### 1.4.4.2 散点图
**提示:**颜色根据角度进行分配
[](http://scipy-lectures.github.io/intro/auto_examples/plot_scatter_ex.html)
从下面的代码开始,试着重新生成这个图片,小心处理标记的大小颜色和透明度:
```
n = 1024
X = np.random.normal(0,1,n)
Y = np.random.normal(0,1,n)
pl.scatter(X,Y)
```
点击图片查看答案。
### 1.4.4.3 柱状图
**提示:**你需要小心文本对齐
[](http://scipy-lectures.github.io/intro/auto_examples/plot_bar_ex.html)
从下面的代码开始,试着重新生成这个图片,添加红柱的标签。
```
n = 12
X = np.arange(n)
Y1 = (1 - X / float(n)) * np.random.uniform(0.5, 1.0, n)
Y2 = (1 - X / float(n)) * np.random.uniform(0.5, 1.0, n)
pl.bar(X, +Y1, facecolor='#9999ff', edgecolor='white')
pl.bar(X, -Y2, facecolor='#ff9999', edgecolor='white')
for x, y in zip(X, Y1):
pl.text(x + 0.4, y + 0.05, '%.2f' % y, ha='center', va='bottom')
pl.ylim(-1.25, +1.25)
```
点击图片查看答案。
### 1.4.4.4 轮廓图
**提示:**你需要是使用[clabel](http://matplotlib.sourceforge.net/api/pyplot_api.html#matplotlib.pyplot.clabel)命令。
[](http://scipy-lectures.github.io/intro/auto_examples/plot_contour_ex.html)
从下面的代码开始,试着重新生成这个图片,小心处理colormap (见下面的[Colormaps](http://scipy-lectures.github.io/intro/matplotlib/matplotlib.html#colormaps))。
```
def f(x, y):
return (1 - x / 2 + x ** 5 + y ** 3) * np.exp(-x ** 2 -y ** 2)
n = 256
x = np.linspace(-3, 3, n)
y = np.linspace(-3, 3, n)
X, Y = np.meshgrid(x, y)
pl.contourf(X, Y, f(X, Y), 8, alpha=.75, cmap='jet')
C = pl.contour(X, Y, f(X, Y), 8, colors='black', linewidth=.5)
```
点击图片查看答案。
### 1.4.4.5 Imshow
**提示:**你需要小心处理在imshow命令中的图像_原点_并使用[colorbar](http://matplotlib.sourceforge.net/api/pyplot_api.html#matplotlib.pyplot.colorbar)
[](http://scipy-lectures.github.io/intro/auto_examples/plot_imshow_ex.html)
从下面的代码开始,试着重新生成这个图片,小心处理colormap和图像插入以及原点。
```
def f(x, y):
return (1 - x / 2 + x ** 5 + y ** 3) * np.exp(-x ** 2 - y ** 2)
n = 10
x = np.linspace(-3, 3, 4 * n)
y = np.linspace(-3, 3, 3 * n)
X, Y = np.meshgrid(x, y)
pl.imshow(f(X, Y))
```
点击图片查看答案。
### 1.4.4.6 饼图
**提示:**你需要调整Z。
[](http://scipy-lectures.github.io/intro/auto_examples/plot_pie_ex.html)
从下面的代码开始,试着重新生成这个图片,小心处理颜色和切片大小。
```
Z = np.random.uniform(0, 1, 20)
pl.pie(Z)
```
点击图片查看答案。
### 1.4.4.7 梯度图
**提示:**你需要绘制两次箭头。
[](http://scipy-lectures.github.io/intro/auto_examples/plot_quiver_ex.html)
从下面的代码开始,试着重新生成这个图片,小心处理颜色和方向。
```
n = 8
X, Y = np.mgrid[0:n, 0:n]
pl.quiver(X, Y)
```
点击图片查看答案。
### 1.4.4.8 网格
[](http://scipy-lectures.github.io/intro/auto_examples/plot_grid_ex.html)
从下面的代码开始,试着重新生成这个图片,小心处理线的样式。
```
axes = pl.gca()
axes.set_xlim(0, 4)
axes.set_ylim(0, 3)
axes.set_xticklabels([])
axes.set_yticklabels([])
```
点击图片查看答案。
### 1.4.4.9 多图
**提示:**你可以用不同的分割来使用多个子图。
[](http://scipy-lectures.github.io/intro/auto_examples/plot_multiplot_ex.html)
```
pl.subplot(2, 2, 1)
pl.subplot(2, 2, 3)
pl.subplot(2, 2, 4)
```
点击图片查看答案。
### 1.4.4.10 极坐标系
**提示:**你只需要修改`axes`行。
[](http://scipy-lectures.github.io/intro/auto_examples/plot_polar_ex.html)
从下面的代码开始,试着重新生成这个图片。
```
pl.axes([0, 0, 1, 1])
N = 20
theta = np.arange(0., 2 * np.pi, 2 * np.pi / N)
radii = 10 * np.random.rand(N)
width = np.pi / 4 * np.random.rand(N)
bars = pl.bar(theta, radii, width=width, bottom=0.0)
for r, bar in zip(radii, bars):
bar.set_facecolor(cm.jet(r / 10.))
bar.set_alpha(0.5)
```
点击图片查看答案。
### 1.4.4.11 3D绘图
**提示:**你需要使用[contourf](http://matplotlib.sourceforge.net/api/pyplot_api.html#matplotlib.pyplot.contourf)
[](http://scipy-lectures.github.io/intro/auto_examples/plot_plot3d_ex.html)
从下面的代码开始,试着重新生成这个图片。
```
from mpl_toolkits.mplot3d import Axes3D
fig = pl.figure()
ax = Axes3D(fig)
X = np.arange(-4, 4, 0.25)
Y = np.arange(-4, 4, 0.25)
X, Y = np.meshgrid(X, Y)
R = np.sqrt(X**2 + Y**2)
Z = np.sin(R)
ax.plot_surface(X, Y, Z, rstride=1, cstride=1, cmap='hot')
```
点击图片查看答案。
**更多请见**:[用Mayavi 3D绘图](http://scipy-lectures.github.io/packages/3d_plotting/index.html#mayavi-label)
### 1.4.4.12 文本
**提示:**看一下[matplotlib标识](http://matplotlib.org/examples/api/logo2.html)
[](http://scipy-lectures.github.io/intro/auto_examples/plot_text_ex.html)
试着从0开始做这个事情!
点击图片查看答案。
**快速阅读**
如果你想要快速看一下Scipy讲座以便了解生态系统,你可以直接跳到下一章:Scipy:高级科学计算。
本章的剩余部分对理解其他的介绍部分不是必须的。但是,请确保在稍后回来完成这个章节。
## 1.4.5 这本教程之外
Matplotlib从大量的文档以及用户和开发者社区中收益匪浅。这里是一些有趣的链接:
### 1.4.5.1 教程
* [Pyplot教程](http://matplotlib.sourceforge.net/users/pyplot_tutorial.html)
* 介绍
* 控制line属性
* 处理多个图形和坐标轴
* 处理文本
* [Image教程](http://matplotlib.sourceforge.net/users/image_tutorial.html)
* 开始命令
* 从Numpy数组中导入图像数据
* 将numpy数组绘制为图像
* [Text教程](http://matplotlib.sourceforge.net/users/index_text.html)
* Text介绍
* 基本text命令
* Text属性和布局
* 写数学表达式
* 用LaTeX渲染文本
* 文本注释
* [Artist教程](http://matplotlib.org/users/artists.html)
* 介绍
* 自定义你的对象
* 对象容器
* Figure容器
* Axes容器
* Axis容器
* 刻度容器
* [Path教程](http://matplotlib.sourceforge.net/users/path_tutorial.html)
* 介绍
* Bézier例子
* 复合路径
* [转换教程](http://matplotlib.sourceforge.net/users/transforms_tutorial.html)
* 介绍
* 数据坐标
* Axes坐标
* 混合转换
* 用offset转换来穿件一个阴影效果
* pipline转换
### 1.4.5.2 Matplotlib文档
* [用户手册](http://matplotlib.sourceforge.net/users/index.html)
* [常见问题](http://matplotlib.sourceforge.net/faq/index.html)
* 安装
* 使用
* 如何使用
* 故障排除
* 环境变量
* [屏幕截图](http://matplotlib.sourceforge.net/users/screenshots.html)
### 1.4.5.3 代码文档
代码都有很好的文档,你可以在Python会话中用特定命令很快的访问:
In [3]:
```
import pylab as pl
help(pl.plot)
```
```
Help on function plot in module matplotlib.pyplot:
plot(*args, **kwargs)
Plot lines and/or markers to the
:class:`~matplotlib.axes.Axes`. *args* is a variable length
argument, allowing for multiple *x*, *y* pairs with an
optional format string. For example, each of the following is
legal::
plot(x, y) # plot x and y using default line style and color
plot(x, y, 'bo') # plot x and y using blue circle markers
plot(y) # plot y using x as index array 0..N-1
plot(y, 'r+') # ditto, but with red plusses
If *x* and/or *y* is 2-dimensional, then the corresponding columns
will be plotted.
An arbitrary number of *x*, *y*, *fmt* groups can be
specified, as in::
a.plot(x1, y1, 'g^', x2, y2, 'g-')
Return value is a list of lines that were added.
By default, each line is assigned a different color specified by a
'color cycle'. To change this behavior, you can edit the
axes.color_cycle rcParam.
The following format string characters are accepted to control
the line style or marker:
================ ===============================
character description
================ ===============================
``'-'`` solid line style
``'--'`` dashed line style
``'-.'`` dash-dot line style
``':'`` dotted line style
``'.'`` point marker
``','`` pixel marker
``'o'`` circle marker
``'v'`` triangle_down marker
``'^'`` triangle_up marker
``'<'`` triangle_left marker
``'>'`` triangle_right marker
``'1'`` tri_down marker
``'2'`` tri_up marker
``'3'`` tri_left marker
``'4'`` tri_right marker
``'s'`` square marker
``'p'`` pentagon marker
``'*'`` star marker
``'h'`` hexagon1 marker
``'H'`` hexagon2 marker
``'+'`` plus marker
``'x'`` x marker
``'D'`` diamond marker
``'d'`` thin_diamond marker
``'|'`` vline marker
``'_'`` hline marker
================ ===============================
The following color abbreviations are supported:
========== ========
character color
========== ========
'b' blue
'g' green
'r' red
'c' cyan
'm' magenta
'y' yellow
'k' black
'w' white
========== ========
In addition, you can specify colors in many weird and
wonderful ways, including full names (``'green'``), hex
strings (``'#008000'``), RGB or RGBA tuples (``(0,1,0,1)``) or
grayscale intensities as a string (``'0.8'``). Of these, the
string specifications can be used in place of a ``fmt`` group,
but the tuple forms can be used only as ``kwargs``.
Line styles and colors are combined in a single format string, as in
``'bo'`` for blue circles.
The *kwargs* can be used to set line properties (any property that has
a ``set_*`` method). You can use this to set a line label (for auto
legends), linewidth, anitialising, marker face color, etc. Here is an
example::
plot([1,2,3], [1,2,3], 'go-', label='line 1', linewidth=2)
plot([1,2,3], [1,4,9], 'rs', label='line 2')
axis([0, 4, 0, 10])
legend()
If you make multiple lines with one plot command, the kwargs
apply to all those lines, e.g.::
plot(x1, y1, x2, y2, antialised=False)
Neither line will be antialiased.
You do not need to use format strings, which are just
abbreviations. All of the line properties can be controlled
by keyword arguments. For example, you can set the color,
marker, linestyle, and markercolor with::
plot(x, y, color='green', linestyle='dashed', marker='o',
markerfacecolor='blue', markersize=12).
See :class:`~matplotlib.lines.Line2D` for details.
The kwargs are :class:`~matplotlib.lines.Line2D` properties:
agg_filter: unknown
alpha: float (0.0 transparent through 1.0 opaque)
animated: [True | False]
antialiased or aa: [True | False]
axes: an :class:`~matplotlib.axes.Axes` instance
clip_box: a :class:`matplotlib.transforms.Bbox` instance
clip_on: [True | False]
clip_path: [ (:class:`~matplotlib.path.Path`, :class:`~matplotlib.transforms.Transform`) | :class:`~matplotlib.patches.Patch` | None ]
color or c: any matplotlib color
contains: a callable function
dash_capstyle: ['butt' | 'round' | 'projecting']
dash_joinstyle: ['miter' | 'round' | 'bevel']
dashes: sequence of on/off ink in points
drawstyle: ['default' | 'steps' | 'steps-pre' | 'steps-mid' | 'steps-post']
figure: a :class:`matplotlib.figure.Figure` instance
fillstyle: ['full' | 'left' | 'right' | 'bottom' | 'top' | 'none']
gid: an id string
label: string or anything printable with '%s' conversion.
linestyle or ls: [``'-'`` | ``'--'`` | ``'-.'`` | ``':'`` | ``'None'`` | ``' '`` | ``''``]
linewidth or lw: float value in points
lod: [True | False]
marker: unknown
markeredgecolor or mec: any matplotlib color
markeredgewidth or mew: float value in points
markerfacecolor or mfc: any matplotlib color
markerfacecoloralt or mfcalt: any matplotlib color
markersize or ms: float
markevery: unknown
path_effects: unknown
picker: float distance in points or callable pick function ``fn(artist, event)``
pickradius: float distance in points
rasterized: [True | False | None]
sketch_params: unknown
snap: unknown
solid_capstyle: ['butt' | 'round' | 'projecting']
solid_joinstyle: ['miter' | 'round' | 'bevel']
transform: a :class:`matplotlib.transforms.Transform` instance
url: a url string
visible: [True | False]
xdata: 1D array
ydata: 1D array
zorder: any number
kwargs *scalex* and *scaley*, if defined, are passed on to
:meth:`~matplotlib.axes.Axes.autoscale_view` to determine
whether the *x* and *y* axes are autoscaled; the default is
*True*.
Additional kwargs: hold = [True|False] overrides default hold state
```
### 1.4.5.4 画廊
当你搜索如何提供一个特定图片时,[matplotlib画廊](http://matplotlib.sourceforge.net/gallery.html)也非常有用。每个例子都有源码。
[这里](http://www.loria.fr/~rougier/coding/gallery/)有一个小的画廊。
### 1.4.5.5 邮件列表
最后,你可以在[用户邮件列表](https://lists.sourceforge.net/lists/listinfo/matplotlib-users)寻求帮助,而[开发者邮件列表](https://lists.sourceforge.net/lists/listinfo/matplotlib-devel)则更偏技术。
## 1.4.6 快速参考
这里是一组表格,显示了主要的属性和样式。
### 1.4.6.1 Line属性
| 属性 | 描述 | 外观 |
| --- | --- | --- |
| alpha (or a) | alpha 0-1范围的透明度 |  |
| antialiased | True or False - use antialised rendering |   |
| color (or c) | matplotlib颜色参数 |  |
| linestyle (or ls) | see [Line属性](#line-properties) |
| linewidth (or lw) | 浮点, 线宽度用小数表示 |  |
| solid_capstyle | 实线头的样式 |  |
| solid_joinstyle | 实线的连接样式 |  |
| dash_capstyle | 虚线头的样式 |  |
| dash_joinstyle | 虚线的连接样式 |  |
| marker | see [标记](#markers) |
| markeredgewidth (mew) | 标记符号的线宽度 |  |
| markeredgecolor (mec) | 标记边缘的颜色 |  |
| markerfacecolor (mfc) | 标记的填充颜色 |  |
| markersize (ms) | 标记的大小,以小数表示 |  |
### 1.4.6.2 线样式

### 1.4.6.3 标记

### 1.4.6.4 Colormaps
所有colormap都可以通过添加`_r`来进行颜色反转。例如`gray_r`是`gray`的补色。
如果你想要更多了解colormaps,检查一下[matplotlib colormaps的文档](https://gist.github.com/2719900)

1.3 NumPy:创建和操作数值数据
最后更新于:2022-04-01 11:21:29
# 1.3 NumPy:创建和操作数值数据
> 作者:Emmanuelle Gouillart、Didrik Pinte、Gaël Varoquaux 和 Pauli Virtanen
本章给出关于Numpy概述,Numpy是Python中高效数值计算的核心工具。
## 1.3.1 Numpy 数组对象
### 1.3.1.1 什么是Numpy以及Numpy数组?
#### 1.3.1.1.1 Numpy数组
**Python对象:**
* 高级数值对象:整数、浮点
* 容器:列表(无成本插入和附加),字典(快速查找)
**Numpy提供:**
* 对于多维度数组的Python扩展包
* 更贴近硬件(高效)
* 为科学计算设计(方便)
* 也称为_面向数组计算_
In [1]:
```
import numpy as np
a = np.array([0, 1, 2, 3])
a
```
Out[1]:
```
array([0, 1, 2, 3])
```
例如,数组包含:
* 实验或模拟在离散时间阶段的值
* 测量设备记录的信号,比如声波
* 图像的像素、灰度或颜色
* 用不同X-Y-Z位置测量的3-D数据,例如MRI扫描
...
**为什么有用:**提供了高速数值操作的节省内存的容器。
In [2]:
```
L = range(1000)
%timeit [i**2 for i in L]
```
```
10000 loops, best of 3: 93.7 µs per loop
```
In [4]:
```
a = np.arange(1000)
%timeit a**2
```
```
100000 loops, best of 3: 2.16 µs per loop
```
#### 1.3.1.1.2 Numpy参考文档
* 线上: [http://docs.scipy.org/](http://docs.scipy.org/)
* 交互帮助:
```
np.array?
String Form:<built-in function array>
Docstring:
array(object, dtype=None, copy=True, order=None, subok=False, ndmin=0, ...
```
查找东西:
In [6]:
```
np.lookfor('create array')
```
```
Search results for 'create array'
---------------------------------
numpy.array
Create an array.
numpy.memmap
Create a memory-map to an array stored in a *binary* file on disk.
numpy.diagflat
Create a two-dimensional array with the flattened input as a diagonal.
numpy.fromiter
Create a new 1-dimensional array from an iterable object.
numpy.partition
Return a partitioned copy of an array.
numpy.ma.diagflat
Create a two-dimensional array with the flattened input as a diagonal.
numpy.ctypeslib.as_array
Create a numpy array from a ctypes array or a ctypes POINTER.
numpy.ma.make_mask
Create a boolean mask from an array.
numpy.ctypeslib.as_ctypes
Create and return a ctypes object from a numpy array. Actually
numpy.ma.mrecords.fromarrays
Creates a mrecarray from a (flat) list of masked arrays.
numpy.lib.format.open_memmap
Open a .npy file as a memory-mapped array.
numpy.ma.MaskedArray.__new__
Create a new masked array from scratch.
numpy.lib.arrayterator.Arrayterator
Buffered iterator for big arrays.
numpy.ma.mrecords.fromtextfile
Creates a mrecarray from data stored in the file `filename`.
numpy.asarray
Convert the input to an array.
numpy.ndarray
ndarray(shape, dtype=float, buffer=None, offset=0,
numpy.recarray
Construct an ndarray that allows field access using attributes.
numpy.chararray
chararray(shape, itemsize=1, unicode=False, buffer=None, offset=0,
numpy.pad
Pads an array.
numpy.sum
Sum of array elements over a given axis.
numpy.asanyarray
Convert the input to an ndarray, but pass ndarray subclasses through.
numpy.copy
Return an array copy of the given object.
numpy.diag
Extract a diagonal or construct a diagonal array.
numpy.load
Load arrays or pickled objects from ``.npy``, ``.npz`` or pickled files.
numpy.sort
Return a sorted copy of an array.
numpy.array_equiv
Returns True if input arrays are shape consistent and all elements equal.
numpy.dtype
Create a data type object.
numpy.choose
Construct an array from an index array and a set of arrays to choose from.
numpy.nditer
Efficient multi-dimensional iterator object to iterate over arrays.
numpy.swapaxes
Interchange two axes of an array.
numpy.full_like
Return a full array with the same shape and type as a given array.
numpy.ones_like
Return an array of ones with the same shape and type as a given array.
numpy.empty_like
Return a new array with the same shape and type as a given array.
numpy.zeros_like
Return an array of zeros with the same shape and type as a given array.
numpy.asarray_chkfinite
Convert the input to an array, checking for NaNs or Infs.
numpy.diag_indices
Return the indices to access the main diagonal of an array.
numpy.ma.choose
Use an index array to construct a new array from a set of choices.
numpy.chararray.tolist
a.tolist()
numpy.matlib.rand
Return a matrix of random values with given shape.
numpy.savez_compressed
Save several arrays into a single file in compressed ``.npz`` format.
numpy.ma.empty_like
Return a new array with the same shape and type as a given array.
numpy.ma.make_mask_none
Return a boolean mask of the given shape, filled with False.
numpy.ma.mrecords.fromrecords
Creates a MaskedRecords from a list of records.
numpy.around
Evenly round to the given number of decimals.
numpy.source
Print or write to a file the source code for a Numpy object.
numpy.diagonal
Return specified diagonals.
numpy.histogram2d
Compute the bi-dimensional histogram of two data samples.
numpy.fft.ifft
Compute the one-dimensional inverse discrete Fourier Transform.
numpy.fft.ifftn
Compute the N-dimensional inverse discrete Fourier Transform.
numpy.busdaycalendar
A business day calendar object that efficiently stores information
```
```
np.con*?
np.concatenate
np.conj
np.conjugate
np.convolve
```
#### 1.3.1.1.3 导入惯例
导入numpy的推荐惯例是:
In [8]:
```
import numpy as np
```
### 1.3.1.2 创建数组
#### 1.3.1.2.1 手动构建数组
* 1-D:
In [9]:
```
a = np.array([0, 1, 2, 3])
a
```
Out[9]:
```
array([0, 1, 2, 3])
```
In [10]:
```
a.ndim
```
Out[10]:
```
1
```
In [11]:
```
a.shape
```
Out[11]:
```
(4,)
```
In [12]:
```
len(a)
```
Out[12]:
```
4
```
* 2-D,3-D,...:
In [13]:
```
b = np.array([[0, 1, 2], [3, 4, 5]]) # 2 x 3 数组
b
```
Out[13]:
```
array([[0, 1, 2],
[3, 4, 5]])
```
In [14]:
```
b.ndim
```
Out[14]:
```
2
```
In [15]:
```
b.shape
```
Out[15]:
```
(2, 3)
```
In [16]:
```
len(b) # 返回一个纬度的大小
```
Out[16]:
```
2
```
In [17]:
```
c = np.array([[[1], [2]], [[3], [4]]])
c
```
Out[17]:
```
array([[[1],
[2]],
[[3],
[4]]])
```
In [18]:
```
c.shape
```
Out[18]:
```
(2, 2, 1)
```
**练习:简单数组**
* 创建一个简单的二维数组。首先,重复上面的例子。然后接着你自己的:在第一行从后向前数奇数,接着第二行数偶数?
* 在这些数组上使用函数[len()](http://docs.python.org/2.7/library/functions.html#len)、numpy.shape()。他们有什么关系?与数组的`ndim`属性间呢?
#### 1.3.1.2.2 创建数组的函数
实际上,我们很少一个项目接一个项目输入...
* 均匀分布:
In [19]:
```
a = np.arange(10) # 0 .. n-1 (!)
a
```
Out[19]:
```
array([0, 1, 2, 3, 4, 5, 6, 7, 8, 9])
```
In [20]:
```
b = np.arange(1, 9, 2) # 开始,结束(不包含),步长
b
```
Out[20]:
```
array([1, 3, 5, 7])
```
* 或者通过一些数据点:
In [1]:
```
c = np.linspace(0, 1, 6) # 起点、终点、数据点
c
```
Out[1]:
```
array([ 0\. , 0.2, 0.4, 0.6, 0.8, 1\. ])
```
In [2]:
```
d = np.linspace(0, 1, 5, endpoint=False)
d
```
Out[2]:
```
array([ 0\. , 0.2, 0.4, 0.6, 0.8])
```
* 普通数组:
In [3]:
```
a = np.ones((3, 3)) # 提示: (3, 3) 是元组
a
```
Out[3]:
```
array([[ 1., 1., 1.],
[ 1., 1., 1.],
[ 1., 1., 1.]])
```
In [4]:
```
b = np.zeros((2, 2))
b
```
Out[4]:
```
array([[ 0., 0.],
[ 0., 0.]])
```
In [5]:
```
c = np.eye(3)
c
```
Out[5]:
```
array([[ 1., 0., 0.],
[ 0., 1., 0.],
[ 0., 0., 1.]])
```
In [6]:
```
d = np.diag(np.array([1, 2, 3, 4]))
d
```
Out[6]:
```
array([[1, 0, 0, 0],
[0, 2, 0, 0],
[0, 0, 3, 0],
[0, 0, 0, 4]])
```
* `np.random`: 随机数 (Mersenne Twister PRNG) :
In [7]:
```
a = np.random.rand(4) # [0, 1] 的均匀分布
a
```
Out[7]:
```
array([ 0.05504731, 0.38154156, 0.39639478, 0.22379146])
```
In [8]:
```
b = np.random.randn(4) # 高斯
b
```
Out[8]:
```
array([ 0.9895903 , 1.85061188, 1.0021666 , -0.63782069])
```
In [9]:
```
np.random.seed(1234) # 设置随机种子
```
In [10]:
```
np.random.rand?
```
**练习:用函数创建数组**
* 实验用`arange`、`linspace`、`ones`、`zeros`、`eye`和`diag`。
* 用随机数创建不同类型的数组。
* 在创建带有随机数的数组前设定种子。
* 看一下函数`np.empty`。它能做什么?什么时候会比较有用?
### 1.3.1.3基础数据类型
你可能已经发现,在一些情况下,数组元素显示带有点(即 2\. VS 2)。这是因为所使用的数据类型不同:
In [12]:
```
a = np.array([1, 2, 3])
a.dtype
```
Out[12]:
```
dtype('int64')
```
In [13]:
```
b = np.array([1., 2., 3.])
b
```
Out[13]:
```
array([ 1., 2., 3.])
```
不同的数据类型可以更紧凑的在内存中存储数据,但是大多数时候我们都只是操作浮点数据。注意,在上面的例子中,Numpy自动从输入中识别了数据类型。
你可以明确的指定想要的类型:
In [1]:
```
c = np.array([1, 2, 3], dtype=float)
c.dtype
```
Out[1]:
```
dtype('float64')
```
**默认**数据类型是浮点:
In [2]:
```
a = np.ones((3, 3))
a.dtype
```
Out[2]:
```
dtype('float64')
```
其他类型:
**复数**:
In [4]:
```
d = np.array([1+2j, 3+4j, 5+6*1j])
d.dtype
```
Out[4]:
```
dtype('complex128')
```
**布尔**:
In [5]:
```
e = np.array([True, False, False, True])
e.dtype
```
Out[5]:
```
dtype('bool')
```
**字符**:
In [6]:
```
f = np.array(['Bonjour', 'Hello', 'Hallo',])
f.dtype # <--- 包含最多7个字母的字符
```
Out[6]:
```
dtype('S7')
```
**更多**:
* int32
* int64
* unit32
* unit64
### 1.3.1.4基本可视化
现在我们有了第一个数组,我们将要进行可视化。
从_pylab_模式启动IPython。
```
ipython --pylab
```
或notebook:
```
ipython notebook --pylab=inline
```
或者如果IPython已经启动,那么:
In [119]:
```
%pylab
```
```
Using matplotlib backend: MacOSX
Populating the interactive namespace from numpy and matplotlib
```
或者从Notebook中:
In [121]:
```
%pylab inline
```
```
Populating the interactive namespace from numpy and matplotlib
```
`inline` 对notebook来说很重要,以便绘制的图片在notebook中显示而不是在新窗口显示。
_Matplotlib_是2D制图包。我们可以像下面这样导入它的方法:
In [10]:
```
import matplotlib.pyplot as plt #整洁形式
```
然后使用(注你需要显式的使用 `show` ):
```
plt.plot(x, y) # 线图
plt.show() # <-- 显示图表(使用pylab的话不需要)
```
或者,如果你使用 `pylab`:
```
plt.plot(x, y) # 线图
```
在脚本中推荐使用 `import matplotlib.pyplot as plt`。 而交互的探索性工作中用 `pylab`。
* 1D作图:
In [12]:
```
x = np.linspace(0, 3, 20)
y = np.linspace(0, 9, 20)
plt.plot(x, y) # 线图
```
Out[12]:
```
[<matplotlib.lines.Line2D at 0x1068f38d0>]
```
In [13]:
```
plt.plot(x, y, 'o') # 点图
```
Out[13]:
```
[<matplotlib.lines.Line2D at 0x106b32090>]
```
* 2D 作图:
In [14]:
```
image = np.random.rand(30, 30)
plt.imshow(image, cmap=plt.cm.hot)
plt.colorbar()
```
Out[14]:
```
<matplotlib.colorbar.Colorbar instance at 0x106a095f0>
```
更多请见matplotlib部分(暂缺)
**练习**:简单可视化
画出简单的数组:cosine作为时间的一个函数以及2D矩阵。
在2D矩阵上试试使用 `gray` colormap。
#### 1.3.1.5索引和切片
数组的项目可以用与其他Python序列(比如:列表)一样的方式访问和赋值:
In [15]:
```
a = np.arange(10)
a
```
Out[15]:
```
array([0, 1, 2, 3, 4, 5, 6, 7, 8, 9])
```
In [16]:
```
a[0], a[2], a[-1]
```
Out[16]:
```
(0, 2, 9)
```
**警告**:索引从0开始与其他的Python序列(以及C/C++)一样。相反,在Fortran或者Matlab索引从1开始。
使用常用的Python风格来反转一个序列也是支持的:
In [17]:
```
a[::-1]
```
Out[17]:
```
array([9, 8, 7, 6, 5, 4, 3, 2, 1, 0])
```
对于多维数组,索引是整数的元组:
In [18]:
```
a = np.diag(np.arange(3))
a
```
Out[18]:
```
array([[0, 0, 0],
[0, 1, 0],
[0, 0, 2]])
```
In [19]:
```
a[1, 1]
```
Out[19]:
```
1
```
In [21]:
```
a[2, 1] = 10 # 第三行,第二列
a
```
Out[21]:
```
array([[ 0, 0, 0],
[ 0, 1, 0],
[ 0, 10, 2]])
```
In [22]:
```
a[1]
```
Out[22]:
```
array([0, 1, 0])
```
**注**:
* 在2D数组中,第一个纬度对应行,第二个纬度对应列。
* 对于多维度数组 `a`,a[0]被解释为提取在指定纬度的所有元素
**切片**:数组与其他Python序列也可以被切片:
In [23]:
```
a = np.arange(10)
a
```
Out[23]:
```
array([0, 1, 2, 3, 4, 5, 6, 7, 8, 9])
```
In [24]:
```
a[2:9:3] # [开始:结束:步长]
```
Out[24]:
```
array([2, 5, 8])
```
注意最后一个索引是不包含的!:
In [25]:
```
a[:4]
```
Out[25]:
```
array([0, 1, 2, 3])
```
切片的三个元素都不是必选:默认情况下,起点是0,结束是最后一个,步长是1:
In [26]:
```
a[1:3]
```
Out[26]:
```
array([1, 2])
```
In [27]:
```
a[::2]
```
Out[27]:
```
array([0, 2, 4, 6, 8])
```
In [28]:
```
a[3:]
```
Out[28]:
```
array([3, 4, 5, 6, 7, 8, 9])
```
Numpy索引和切片的一个小说明...

赋值和切片可以结合在一起:
In [29]:
```
a = np.arange(10)
a[5:] = 10
a
```
Out[29]:
```
array([ 0, 1, 2, 3, 4, 10, 10, 10, 10, 10])
```
In [30]:
```
b = np.arange(5)
a[5:] = b[::-1]
a
```
Out[30]:
```
array([0, 1, 2, 3, 4, 4, 3, 2, 1, 0])
```
**练习:索引与切片**
* 试试切片的特色,用起点、结束和步长:从linspace开始,试着从后往前获得奇数,从前往后获得偶数。 重现上面示例中的切片。你需要使用下列表达式创建这个数组:
In [31]:
```
np.arange(6) + np.arange(0, 51, 10)[:, np.newaxis]
```
Out[31]:
```
array([[ 0, 1, 2, 3, 4, 5],
[10, 11, 12, 13, 14, 15],
[20, 21, 22, 23, 24, 25],
[30, 31, 32, 33, 34, 35],
[40, 41, 42, 43, 44, 45],
[50, 51, 52, 53, 54, 55]])
```
**练习:数组创建**
创建下列的数组(用正确的数据类型):
```
[[1, 1, 1, 1],
[1, 1, 1, 1],
[1, 1, 1, 2],
[1, 6, 1, 1]]
[[0., 0., 0., 0., 0.],
[2., 0., 0., 0., 0.],
[0., 3., 0., 0., 0.],
[0., 0., 4., 0., 0.],
[0., 0., 0., 5., 0.],
[0., 0., 0., 0., 6.]]
```
参考标准:每个数组
提示:每个数组元素可以像列表一样访问,即a[1] 或 a[1, 2]。
提示:看一下 `diag` 的文档字符串。
**练习:创建平铺数组**
看一下 `np.tile` 的文档,是用这个函数创建这个数组:
```
[[4, 3, 4, 3, 4, 3],
[2, 1, 2, 1, 2, 1],
[4, 3, 4, 3, 4, 3],
[2, 1, 2, 1, 2, 1]]
```
### 1.3.1.6 副本和视图
切片操作创建原数组的一个**视图**,这只是访问数组数据一种方式。因此,原始的数组并不是在内存中复制。你可以用 `np.may_share_memory()` 来确认两个数组是否共享相同的内存块。但是请注意,这种方式使用启发式,可能产生漏报。
**当修改视图时,原始数据也被修改:
In [32]:
```
a = np.arange(10)
a
```
Out[32]:
```
array([0, 1, 2, 3, 4, 5, 6, 7, 8, 9])
```
In [33]:
```
b = a[::2]
b
```
Out[33]:
```
array([0, 2, 4, 6, 8])
```
In [34]:
```
np.may_share_memory(a, b)
```
Out[34]:
```
True
```
In [36]:
```
b[0] = 12
b
```
Out[36]:
```
array([12, 2, 4, 6, 8])
```
In [37]:
```
a # (!)
```
Out[37]:
```
array([12, 1, 2, 3, 4, 5, 6, 7, 8, 9])
```
In [38]:
```
a = np.arange(10)
c = a[::2].copy() # 强制复制
c[0] = 12
a
```
Out[38]:
```
array([0, 1, 2, 3, 4, 5, 6, 7, 8, 9])
```
In [39]:
```
np.may_share_memory(a, c)
```
Out[39]:
```
False
```
乍看之下这种行为可能有些奇怪,但是这样做节省了内存和时间。
**实例:素数筛选**
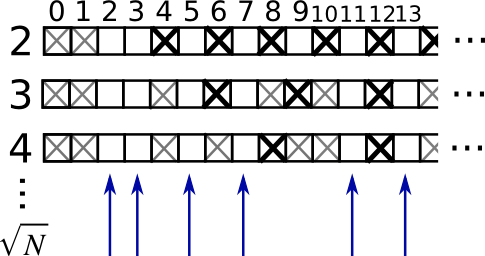
用筛选法计算0-99之间的素数
* 构建一个名为 `_prime` 形状是 (100,) 的布尔数组,在初始将值都设为True:
In [40]:
```
is_prime = np.ones((100,), dtype=bool)
```
* 将不属于素数的0,1去掉
In [41]:
```
is_prime[:2] = 0
```
对于从2开始的整数 `j` ,化掉它的倍数:
In [42]:
```
N_max = int(np.sqrt(len(is_prime)))
for j in range(2, N_max):
is_prime[2*j::j] = False
```
* 看一眼 `help(np.nonzero)`,然后打印素数
* 接下来:
* 将上面的代码放入名为 `prime_sieve.py` 的脚本文件
* 运行检查一下时候有效
* 使用[埃拉托斯特尼筛法](http://en.wikipedia.org/wiki/Sieve_of_Eratosthenes)的优化建议
1. 跳过已知不是素数的 `j`
2. 第一个应该被划掉的数是$j^2$
#### 1.3.1.7象征索引
Numpy数组可以用切片索引,也可以用布尔或整形数组(面具)。这个方法也被称为象征索引。它创建一个副本而不是视图。
#### 1.3.1.7.1使用布尔面具
In [44]:
```
np.random.seed(3)
a = np.random.random_integers(0, 20, 15)
a
```
Out[44]:
```
array([10, 3, 8, 0, 19, 10, 11, 9, 10, 6, 0, 20, 12, 7, 14])
```
In [45]:
```
(a % 3 == 0)
```
Out[45]:
```
array([False, True, False, True, False, False, False, True, False,
True, True, False, True, False, False], dtype=bool)
```
In [47]:
```
mask = (a % 3 == 0)
extract_from_a = a[mask] # 或, a[a%3==0]
extract_from_a # 用面具抽取一个子数组
```
Out[47]:
```
array([ 3, 0, 9, 6, 0, 12])
```
赋值给子数组时,用面具索引非常有用:
In [48]:
```
a[a % 3 == 0] = -1
a
```
Out[48]:
```
array([10, -1, 8, -1, 19, 10, 11, -1, 10, -1, -1, 20, -1, 7, 14])
```
#### 1.3.1.7.2 用整型数组索引
In [49]:
```
a = np.arange(0, 100, 10)
a
```
Out[49]:
```
array([ 0, 10, 20, 30, 40, 50, 60, 70, 80, 90])
```
索引可以用整型数组完成,其中相同的索引重复了几次:
In [50]:
```
a[[2, 3, 2, 4, 2]] # 注:[2, 3, 2, 4, 2] 是Python列表
```
Out[50]:
```
array([20, 30, 20, 40, 20])
```
用这种类型的索引可以分配新值:
In [51]:
```
a[[9, 7]] = -100
a
```
Out[51]:
```
array([ 0, 10, 20, 30, 40, 50, 60, -100, 80, -100])
```
当一个新数组用整型数组索引创建时,新数组有相同的形状,而不是整数数组:
In [52]:
```
a = np.arange(10)
idx = np.array([[3, 4], [9, 7]])
idx.shape
```
Out[52]:
```
(2, 2)
```
In [53]:
```
a[idx]
```
Out[53]:
```
array([[3, 4],
[9, 7]])
```
下图展示了多种象征索引的应用 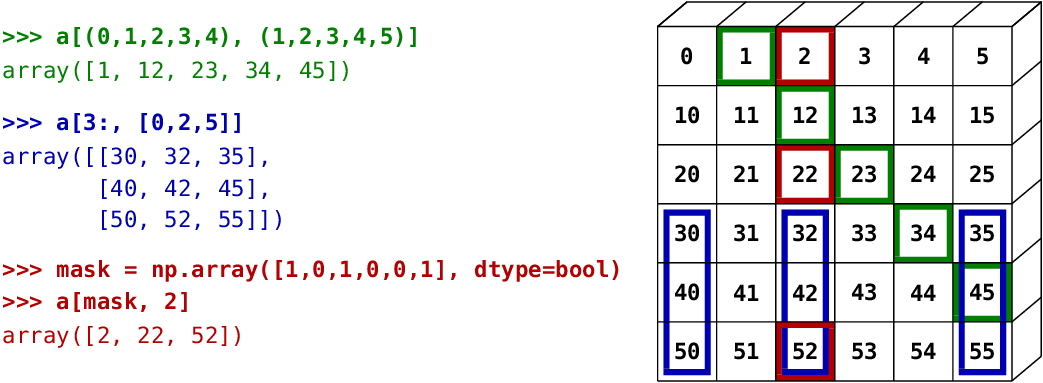
**练习:象征索引**
* 同样,重新生成上图中所示的象征索引
* 用左侧的象征索引和右侧的数组创建在为一个数组赋值,例如,设置上图数组的一部分为0。
## 1.3.2 数组的数值操作
### 1.3.2.1 元素级操作
#### 1.3.2.1.1 基础操作
标量:
In [54]:
```
a = np.array([1, 2, 3, 4])
a + 1
```
Out[54]:
```
array([2, 3, 4, 5])
```
In [55]:
```
2**a
```
Out[55]:
```
array([ 2, 4, 8, 16])
```
所有运算是在元素级别上操作:
In [56]:
```
b = np.ones(4) + 1
a - b
```
Out[56]:
```
array([-1., 0., 1., 2.])
```
In [57]:
```
a * b
```
Out[57]:
```
array([ 2., 4., 6., 8.])
```
In [58]:
```
j = np.arange(5)
2**(j + 1) - j
```
Out[58]:
```
array([ 2, 3, 6, 13, 28])
```
这些操作当然也比你用纯Python实现好快得多:
In [60]:
```
a = np.arange(10000)
%timeit a + 1
```
```
100000 loops, best of 3: 11 µs per loop
```
In [61]:
```
l = range(10000)
%timeit [i+1 for i in l]
```
```
1000 loops, best of 3: 560 µs per loop
```
**注意:数组相乘不是矩阵相乘:**
In [62]:
```
c = np.ones((3, 3))
c * c # 不是矩阵相乘!
```
Out[62]:
```
array([[ 1., 1., 1.],
[ 1., 1., 1.],
[ 1., 1., 1.]])
```
**注:矩阵相乘:**
In [63]:
```
c.dot(c)
```
Out[63]:
```
array([[ 3., 3., 3.],
[ 3., 3., 3.],
[ 3., 3., 3.]])
```
**练习:元素级别的操作**
* 试一下元素级别的简单算术操作
* 用 `%timeit` 比一下他们与纯Python对等物的时间
* 生成:
* `[2**0, 2**1, 2**2, 2**3, 2**4]`
* `a_j = 2^(3*j) - j`
#### 1.3.2.1.2其他操作
**对比:**
In [64]:
```
a = np.array([1, 2, 3, 4])
b = np.array([4, 2, 2, 4])
a == b
```
Out[64]:
```
array([False, True, False, True], dtype=bool)
```
In [65]:
```
a > b
```
Out[65]:
```
array([False, False, True, False], dtype=bool)
```
数组级别的对比:
In [66]:
```
a = np.array([1, 2, 3, 4])
b = np.array([4, 2, 2, 4])
c = np.array([1, 2, 3, 4])
np.array_equal(a, b)
```
Out[66]:
```
False
```
In [67]:
```
np.array_equal(a, c)
```
Out[67]:
```
True
```
**逻辑操作**:
In [68]:
```
a = np.array([1, 1, 0, 0], dtype=bool)
b = np.array([1, 0, 1, 0], dtype=bool)
np.logical_or(a, b)
```
Out[68]:
```
array([ True, True, True, False], dtype=bool)
```
In [69]:
```
np.logical_and(a, b)
```
Out[69]:
```
array([ True, False, False, False], dtype=bool)
```
**[超越函数](http://baike.baidu.com/link?url=3aAGiGcMZFhxRP7D1CWzajcHf-OVCM6L6J1Eaxv1rPxFyEYKRoHXHdcYqKfUIc0q-hcxB_UoE73B5O0GyH1mf_)**
In [71]:
```
a = np.arange(5)
np.sin(a)
```
Out[71]:
```
array([ 0\. , 0.84147098, 0.90929743, 0.14112001, -0.7568025 ])
```
In [72]:
```
np.log(a)
```
```
-c:1: RuntimeWarning: divide by zero encountered in log
```
Out[72]:
```
array([ -inf, 0\. , 0.69314718, 1.09861229, 1.38629436])
```
In [73]:
```
np.exp(a)
```
Out[73]:
```
array([ 1\. , 2.71828183, 7.3890561 , 20.08553692, 54.59815003])
```
**形状不匹配**
In [74]:
```
a = np.arange(4)
a + np.array([1, 2])
```
```
---------------------------------------------------------------------------
ValueError Traceback (most recent call last)
<ipython-input-74-82c1c1d5b8c1> in <module>()
1 a = np.arange(4)
----> 2 a + np.array([1, 2])
ValueError: operands could not be broadcast together with shapes (4,) (2,)
```
_广播_?我们将在[稍后](#Broadcasting)讨论。
**变换**
In [76]:
```
a = np.triu(np.ones((3, 3)), 1) # 看一下 help(np.triu)
a
```
Out[76]:
```
array([[ 0., 1., 1.],
[ 0., 0., 1.],
[ 0., 0., 0.]])
```
In [77]:
```
a.T
```
Out[77]:
```
array([[ 0., 0., 0.],
[ 1., 0., 0.],
[ 1., 1., 0.]])
```
**警告:变换是视图**
因此,下列的代码是错误的,将导致矩阵不对称:
In [78]:
```
a += a.T
```
**注:线性代数**
子模块 `numpy.linalg` 实现了基础的线性代数,比如解开线性系统,奇异值分解等。但是,并不能保证以高效的方式编译,因此,建议使用 `scipy.linalg`, 详细的内容见线性代数操作:`scipy.linalg`(暂缺)。
**练习:其他操作**
* 看一下 `np.allclose` 的帮助,什么时候这很有用?
* 看一下 `np.triu`和 `np.tril`的帮助。
### 1.3.2.2 基础简化
#### 1.3.2.2.1 计算求和
In [79]:
```
x = np.array([1, 2, 3, 4])
np.sum(x)
```
Out[79]:
```
10
```
In [80]:
```
x.sum()
```
Out[80]:
```
10
```
行求和和列求和:
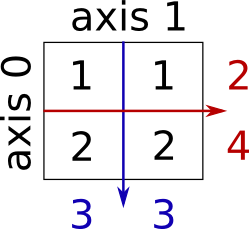
In [81]:
```
x = np.array([[1, 1], [2, 2]])
x
```
Out[81]:
```
array([[1, 1],
[2, 2]])
```
In [83]:
```
x.sum(axis=0) # 列 (第一纬度)
```
Out[83]:
```
array([3, 3])
```
In [84]:
```
x[:, 0].sum(), x[:, 1].sum()
```
Out[84]:
```
(3, 3)
```
In [85]:
```
x.sum(axis=1) # 行 (第二纬度)
```
Out[85]:
```
array([2, 4])
```
In [86]:
```
x[0, :].sum(), x[1, :].sum()
```
Out[86]:
```
(2, 4)
```
相同的思路在高维:
In [87]:
```
x = np.random.rand(2, 2, 2)
x.sum(axis=2)[0, 1]
```
Out[87]:
```
1.2671177193964822
```
In [88]:
```
x[0, 1, :].sum()
```
Out[88]:
```
1.2671177193964822
```
#### 1.3.2.2.2 其他简化
* 以相同方式运作(也可以使用 `axis=` )
**极值**
In [89]:
```
x = np.array([1, 3, 2])
x.min()
```
Out[89]:
```
1
```
In [90]:
```
x.max()
```
Out[90]:
```
3
```
In [91]:
```
x.argmin() # 最小值的索引
```
Out[91]:
```
0
```
In [92]:
```
x.argmax() # 最大值的索引
```
Out[92]:
```
1
```
**逻辑运算**:
In [93]:
```
np.all([True, True, False])
```
Out[93]:
```
False
```
In [94]:
```
np.any([True, True, False])
```
Out[94]:
```
True
```
**注**:可以被应用数组对比:
In [95]:
```
a = np.zeros((100, 100))
np.any(a != 0)
```
Out[95]:
```
False
```
In [96]:
```
np.all(a == a)
```
Out[96]:
```
True
```
In [97]:
```
a = np.array([1, 2, 3, 2])
b = np.array([2, 2, 3, 2])
c = np.array([6, 4, 4, 5])
((a <= b) & (b <= c)).all()
```
Out[97]:
```
True
```
**统计:**
In [98]:
```
x = np.array([1, 2, 3, 1])
y = np.array([[1, 2, 3], [5, 6, 1]])
x.mean()
```
Out[98]:
```
1.75
```
In [99]:
```
np.median(x)
```
Out[99]:
```
1.5
```
In [100]:
```
np.median(y, axis=-1) # 最后的坐标轴
```
Out[100]:
```
array([ 2., 5.])
```
In [101]:
```
x.std() # 全体总体的标准差。
```
Out[101]:
```
0.82915619758884995
```
... 以及其他更多(随着你成长最好学习一下)。
**练习:简化**
* 假定有 `sum` ,你会期望看到哪些其他的函数?
* `sum` 和 `cumsum` 有什么区别?
**实例: 数据统计**
[populations.txt](http://scipy-lectures.github.io/_downloads/populations.txt)中的数据描述了过去20年加拿大北部野兔和猞猁的数量(以及胡萝卜)。
你可以在编辑器或在IPython看一下数据(shell或者notebook都可以):
In [104]:
```
cat data/populations.txt
```
```
# year hare lynx carrot
1900 30e3 4e3 48300
1901 47.2e3 6.1e3 48200
1902 70.2e3 9.8e3 41500
1903 77.4e3 35.2e3 38200
1904 36.3e3 59.4e3 40600
1905 20.6e3 41.7e3 39800
1906 18.1e3 19e3 38600
1907 21.4e3 13e3 42300
1908 22e3 8.3e3 44500
1909 25.4e3 9.1e3 42100
1910 27.1e3 7.4e3 46000
1911 40.3e3 8e3 46800
1912 57e3 12.3e3 43800
1913 76.6e3 19.5e3 40900
1914 52.3e3 45.7e3 39400
1915 19.5e3 51.1e3 39000
1916 11.2e3 29.7e3 36700
1917 7.6e3 15.8e3 41800
1918 14.6e3 9.7e3 43300
1919 16.2e3 10.1e3 41300
1920 24.7e3 8.6e3 47300
```
首先,将数据加载到Numpy数组:
In [107]:
```
data = np.loadtxt('data/populations.txt')
year, hares, lynxes, carrots = data.T # 技巧: 将列分配给变量
```
接下来作图:
In [108]:
```
from matplotlib import pyplot as plt
plt.axes([0.2, 0.1, 0.5, 0.8])
plt.plot(year, hares, year, lynxes, year, carrots)
plt.legend(('Hare', 'Lynx', 'Carrot'), loc=(1.05, 0.5))
```
Out[108]:
```
<matplotlib.legend.Legend at 0x1070407d0>
```
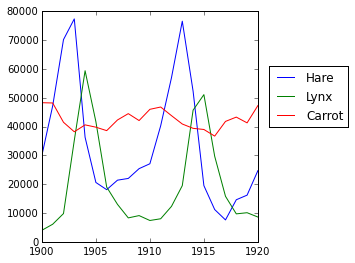
随时间变化的人口平均数:
In [109]:
```
populations = data[:, 1:]
populations.mean(axis=0)
```
Out[109]:
```
array([ 34080.95238095, 20166.66666667, 42400\. ])
```
样本的标准差:
In [110]:
```
populations.std(axis=0)
```
Out[110]:
```
array([ 20897.90645809, 16254.59153691, 3322.50622558])
```
每一年哪个物种有最高的人口?:
In [111]:
```
np.argmax(populations, axis=1)
```
Out[111]:
```
array([2, 2, 0, 0, 1, 1, 2, 2, 2, 2, 2, 2, 0, 0, 0, 1, 2, 2, 2, 2, 2])
```
**实例:随机游走算法扩散**
[random_walk](http://scipy-lectures.github.io/_images/random_walk.png)
让我们考虑一下简单的1维随机游走过程:在每个时间点,行走者以相等的可能性跳到左边或右边。我们感兴趣的是找到随机游走者在 `t` 次左跳或右跳后距离原点的典型距离?我们将模拟许多”行走者“来找到这个规律,并且我们将采用数组计算技巧来计算:我们将创建一个2D数组记录事实,一个方向是经历(每个行走者有一个经历),一个纬度是时间:
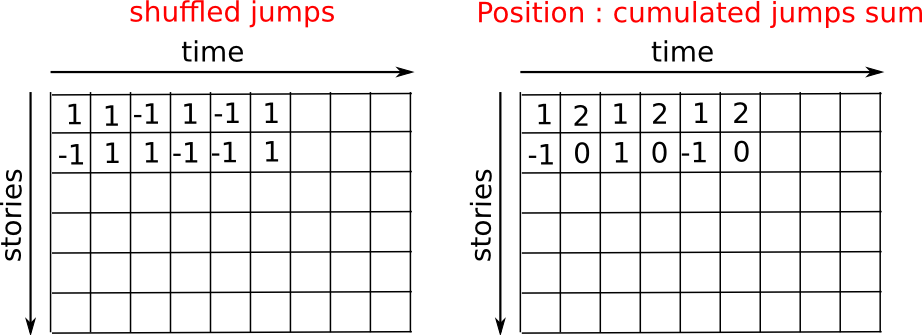
In [113]:
```
n_stories = 1000 # 行走者的数
t_max = 200 # 我们跟踪行走者的时间
```
我们随机选择步长1或-1去行走:
In [115]:
```
t = np.arange(t_max)
steps = 2 * np.random.random_integers(0, 1, (n_stories, t_max)) - 1
np.unique(steps) # 验证: 所有步长是1或-1
```
Out[115]:
```
array([-1, 1])
```
我们通过汇总随着时间的步骤来构建游走
In [116]:
```
positions = np.cumsum(steps, axis=1) # axis = 1: 纬度是时间
sq_distance = positions**2
```
获得经历轴的平均数:
In [117]:
```
mean_sq_distance = np.mean(sq_distance, axis=0)
```
画出结果:
In [126]:
```
plt.figure(figsize=(4, 3))
plt.plot(t, np.sqrt(mean_sq_distance), 'g.', t, np.sqrt(t), 'y-')
plt.xlabel(r"$t$")
plt.ylabel(r"$\sqrt{\langle (\delta x)^2 \rangle}$")
```
Out[126]:
```
<matplotlib.text.Text at 0x10b529450>
```
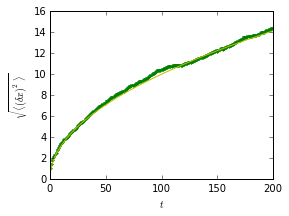
我们找到了物理学上一个著名的结果:均方差记录是时间的平方根!
### 1.3.2.3 广播
* numpy数组的基本操作(相加等)是元素级别的
* 在相同大小的数组上仍然适用。 **尽管如此**, 也可能在不同大小的数组上进行这个操作,假如Numpy可以将这些数组转化为相同的大小:这种转化称为广播。
下图给出了一个广播的例子:
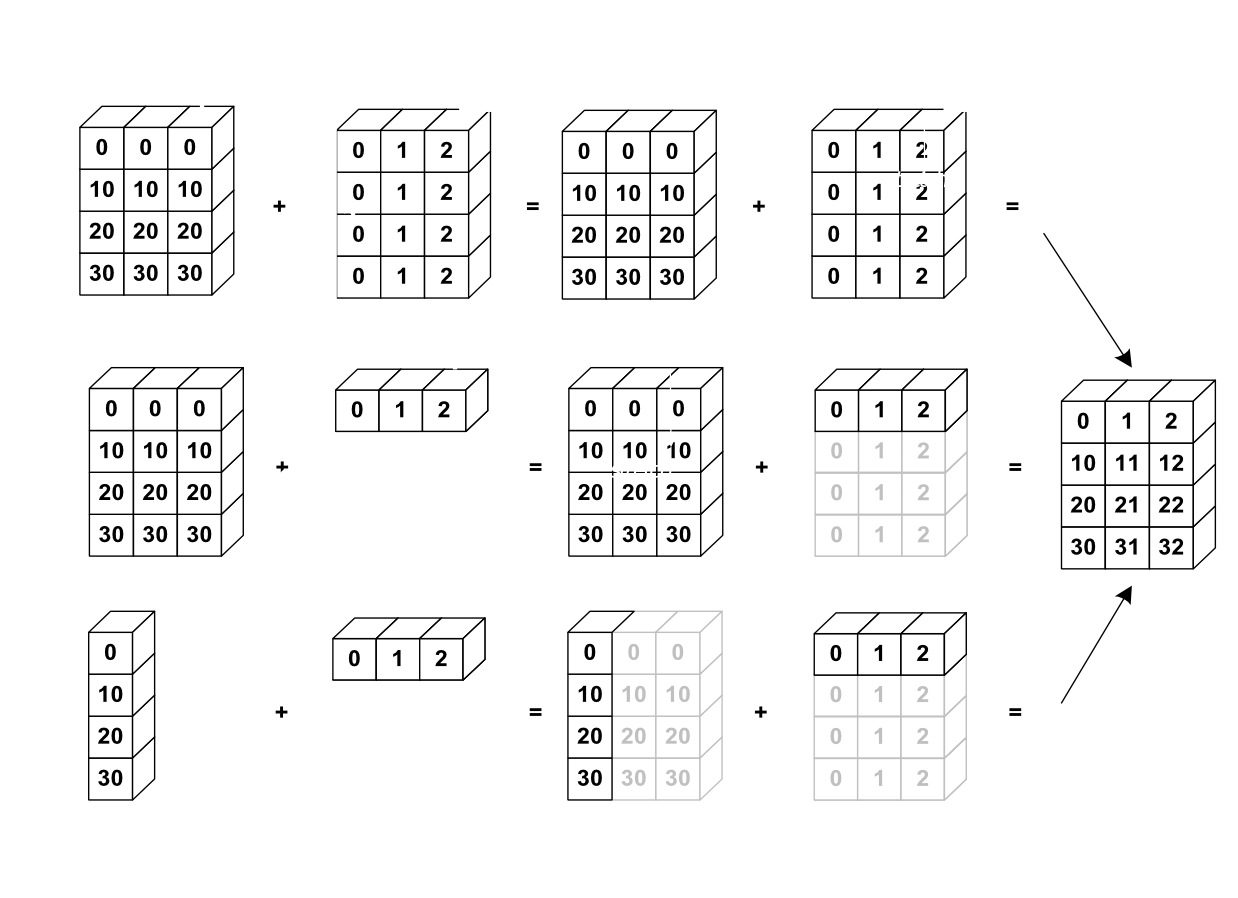
让我们验证一下:
In [127]:
```
a = np.tile(np.arange(0, 40, 10), (3, 1)).T
a
```
Out[127]:
```
array([[ 0, 0, 0],
[10, 10, 10],
[20, 20, 20],
[30, 30, 30]])
```
In [128]:
```
b = np.array([0, 1, 2])
a + b
```
Out[128]:
```
array([[ 0, 1, 2],
[10, 11, 12],
[20, 21, 22],
[30, 31, 32]])
```
在不知道广播的时候已经使用过它!:
In [129]:
```
a = np.ones((4, 5))
a[0] = 2 # 我们将一个数组的纬度0分配给另一个数组的纬度1
a
```
Out[129]:
```
array([[ 2., 2., 2., 2., 2.],
[ 1., 1., 1., 1., 1.],
[ 1., 1., 1., 1., 1.],
[ 1., 1., 1., 1., 1.]])
```
In [130]:
```
a = np.ones((4, 5))
print a[0]
a[0] = 2 # 我们将一个数组的纬度0分配给另一个数组的纬度
a
```
```
[ 1\. 1\. 1\. 1\. 1.]
```
Out[130]:
```
array([[ 2., 2., 2., 2., 2.],
[ 1., 1., 1., 1., 1.],
[ 1., 1., 1., 1., 1.],
[ 1., 1., 1., 1., 1.]])
```
一个有用的技巧:
In [133]:
```
a = np.arange(0, 40, 10)
a.shape
```
Out[133]:
```
(4,)
```
In [134]:
```
a = a[:, np.newaxis] # 添加一个新的轴 -> 2D 数组
a.shape
```
Out[134]:
```
(4, 1)
```
In [135]:
```
a
```
Out[135]:
```
array([[ 0],
[10],
[20],
[30]])
```
In [136]:
```
a + b
```
Out[136]:
```
array([[ 0, 1, 2],
[10, 11, 12],
[20, 21, 22],
[30, 31, 32]])
```
广播看起来很神奇,但是,当我们要解决的问题是输出数据比输入数据有更多纬度的数组时,使用它是非常自然的。
**实例:广播**
让我们创建一个66号公路上城市之间距离(用公里计算)的数组:芝加哥、斯普林菲尔德、圣路易斯、塔尔萨、俄克拉何马市、阿马里洛、圣塔菲、阿尔布开克、Flagstaff、洛杉矶。
In [138]:
```
mileposts = np.array([0, 198, 303, 736, 871, 1175, 1475, 1544, 1913, 2448])
distance_array = np.abs(mileposts - mileposts[:, np.newaxis])
distance_array
```
Out[138]:
```
array([[ 0, 198, 303, 736, 871, 1175, 1475, 1544, 1913, 2448],
[ 198, 0, 105, 538, 673, 977, 1277, 1346, 1715, 2250],
[ 303, 105, 0, 433, 568, 872, 1172, 1241, 1610, 2145],
[ 736, 538, 433, 0, 135, 439, 739, 808, 1177, 1712],
[ 871, 673, 568, 135, 0, 304, 604, 673, 1042, 1577],
[1175, 977, 872, 439, 304, 0, 300, 369, 738, 1273],
[1475, 1277, 1172, 739, 604, 300, 0, 69, 438, 973],
[1544, 1346, 1241, 808, 673, 369, 69, 0, 369, 904],
[1913, 1715, 1610, 1177, 1042, 738, 438, 369, 0, 535],
[2448, 2250, 2145, 1712, 1577, 1273, 973, 904, 535, 0]])
```

许多基于网格或者基于网络的问题都需要使用广播。例如,如果要计算10X10网格中每个点到原点的数据,可以这样:
In [139]:
```
x, y = np.arange(5), np.arange(5)[:, np.newaxis]
distance = np.sqrt(x ** 2 + y ** 2)
distance
```
Out[139]:
```
array([[ 0\. , 1\. , 2\. , 3\. , 4\. ],
[ 1\. , 1.41421356, 2.23606798, 3.16227766, 4.12310563],
[ 2\. , 2.23606798, 2.82842712, 3.60555128, 4.47213595],
[ 3\. , 3.16227766, 3.60555128, 4.24264069, 5\. ],
[ 4\. , 4.12310563, 4.47213595, 5\. , 5.65685425]])
```
或者用颜色:
In [141]:
```
plt.pcolor(distance)
plt.colorbar()
```
Out[141]:
```
<matplotlib.colorbar.Colorbar instance at 0x10d8d7170>
```
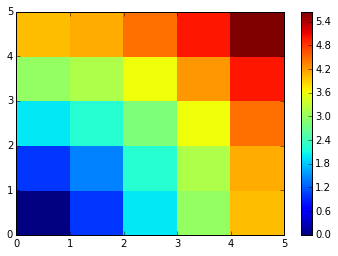
**评论** : `numpy.ogrid` 函数允许直接创建上一个例子中两个**重要纬度**向量X和Y:
In [142]:
```
x, y = np.ogrid[0:5, 0:5]
x, y
```
Out[142]:
```
(array([[0],
[1],
[2],
[3],
[4]]), array([[0, 1, 2, 3, 4]]))
```
In [143]:
```
x.shape, y.shape
```
Out[143]:
```
((5, 1), (1, 5))
```
In [144]:
```
distance = np.sqrt(x ** 2 + y ** 2)
```
因此, `np.ogrid` 就非常有用,只要我们是要处理网格计算。另一方面, 在一些无法(或者不想)从广播中收益的情况下,`np.mgrid` 直接提供了由索引构成的矩阵:
In [145]:
```
x, y = np.mgrid[0:4, 0:4]
x
```
Out[145]:
```
array([[0, 0, 0, 0],
[1, 1, 1, 1],
[2, 2, 2, 2],
[3, 3, 3, 3]])
```
In [146]:
```
y
```
Out[146]:
```
array([[0, 1, 2, 3],
[0, 1, 2, 3],
[0, 1, 2, 3],
[0, 1, 2, 3]])
```
### 1.3.2.4数组形状操作
#### 1.3.2.4.1 扁平
In [147]:
```
a = np.array([[1, 2, 3], [4, 5, 6]])
a.ravel()
```
Out[147]:
```
array([1, 2, 3, 4, 5, 6])
```
In [148]:
```
a.T
```
Out[148]:
```
array([[1, 4],
[2, 5],
[3, 6]])
```
In [149]:
```
a.T.ravel()
```
Out[149]:
```
array([1, 4, 2, 5, 3, 6])
```
高维:后进先出。
#### 1.3.2.4.2 重排
扁平的相反操作:
In [150]:
```
a.shape
```
Out[150]:
```
(2, 3)
```
In [152]:
```
b = a.ravel()
b = b.reshape((2, 3))
b
```
Out[152]:
```
array([[1, 2, 3],
[4, 5, 6]])
```
或者:
In [153]:
```
a.reshape((2, -1)) # 不确定的值(-1)将被推导
```
Out[153]:
```
array([[1, 2, 3],
[4, 5, 6]])
```
**警告**: `ndarray.reshape` 可以返回一个视图(参见 `help(np.reshape)`), 也可以可以返回副本
In [155]:
```
b[0, 0] = 99
a
```
Out[155]:
```
array([[99, 2, 3],
[ 4, 5, 6]])
```
当心:重排也可以返回一个副本!:
In [156]:
```
a = np.zeros((3, 2))
b = a.T.reshape(3*2)
b[0] = 9
a
```
Out[156]:
```
array([[ 0., 0.],
[ 0., 0.],
[ 0., 0.]])
```
要理解这个现象,你需要了解更多关于numpy数组内存设计的知识。
#### 1.3.2.4.3 添加纬度
用 `np.newaxis`对象进行索引可以为一个数组添加轴(在上面关于广播的部分你已经看到过了):
In [157]:
```
z = np.array([1, 2, 3])
z
```
Out[157]:
```
array([1, 2, 3])
```
In [158]:
```
z[:, np.newaxis]
```
Out[158]:
```
array([[1],
[2],
[3]])
```
In [159]:
```
z[np.newaxis, :]
```
Out[159]:
```
array([[1, 2, 3]])
```
#### 1.3.2.4.4 纬度重组
In [160]:
```
a = np.arange(4*3*2).reshape(4, 3, 2)
a.shape
```
Out[160]:
```
(4, 3, 2)
```
In [161]:
```
a[0, 2, 1]
```
Out[161]:
```
5
```
In [163]:
```
b = a.transpose(1, 2, 0)
b.shape
```
Out[163]:
```
(3, 2, 4)
```
In [164]:
```
b[2, 1, 0]
```
Out[164]:
```
5
```
也是创建了一个视图:
In [165]:
```
b[2, 1, 0] = -1
a[0, 2, 1]
```
Out[165]:
```
-1
```
#### 1.3.2.4.5 改变大小
可以用 `ndarray.resize` 改变数组的大小:
In [167]:
```
a = np.arange(4)
a.resize((8,))
a
```
Out[167]:
```
array([0, 1, 2, 3, 0, 0, 0, 0])
```
但是,它不能在其他地方引用:
In [168]:
```
b = a
a.resize((4,))
```
```
---------------------------------------------------------------------------
ValueError Traceback (most recent call last)
<ipython-input-168-59edd3107605> in <module>()
1 b = a
----> 2 a.resize((4,))
ValueError: cannot resize an array that references or is referenced
by another array in this way. Use the resize function
```
**练习:形状操作**
* 看一下 `reshape` 的文档字符串,特别要注意其中关于副本和视图的内容。
* 用 `flatten` 来替换 `ravel`。有什么区别? (提示: 试一下哪个返回视图哪个返回副本)
* 试一下用 `transpose` 来进行纬度变换。
### 1.3.2.5 数据排序
按一个轴排序:
In [169]:
```
a = np.array([[4, 3, 5], [1, 2, 1]])
b = np.sort(a, axis=1)
b
```
Out[169]:
```
array([[3, 4, 5],
[1, 1, 2]])
```
**注**:每行分别排序!
原地排序:
In [170]:
```
a.sort(axis=1)
a
```
Out[170]:
```
array([[3, 4, 5],
[1, 1, 2]])
```
象征索引排序:
In [171]:
```
a = np.array([4, 3, 1, 2])
j = np.argsort(a)
j
```
Out[171]:
```
array([2, 3, 1, 0])
```
In [172]:
```
a[j]
```
Out[172]:
```
array([1, 2, 3, 4])
```
找到最大值和最小值:
In [173]:
```
a = np.array([4, 3, 1, 2])
j_max = np.argmax(a)
j_min = np.argmin(a)
j_max, j_min
```
Out[173]:
```
(0, 2)
```
**练习:排序**
* 试一下原地和非原地排序
* 试一下用不同的数据类型创建数组并且排序。
* 用 `all` 或者 `array_equal` 来检查一下结果。
* 看一下 `np.random.shuffle`,一种更快创建可排序输入的方式。
* 合并 `ravel` 、`sort` 和 `reshape`。
* 看一下 `sort` 的 `axis` 关键字,重写一下这个练习。
### 1.3.2.6 总结
**入门你需要了解什么?**
* 了解如何创建数组:`array`、`arange`、`ones`、`zeros`。
* 了解用 `array.shape`数组的形状,然后使用切片来获得数组的不同视图:`array[::2]`等。用 `reshape`改变数组形状或者用 `ravel`扁平化。
* 获得数组元素的一个子集,和/或用面具修改他们的值ay and/or modify their values with masks
In [174]:
```
a[a < 0] = 0
```
* 了解数组上各式各样的操作,比如找到平均数或最大值 (`array.max()`、`array.mean()`)。不需要记住所有东西,但是应该有条件反射去搜索文档 (线上文档, `help()`, `lookfor()`)!!
* 更高级的用法:掌握用整型数组索引,以及广播。了解更多的Numpy函数以便处理多种数组操作。
**快读阅读**
如果你想要快速通过科学讲座笔记来学习生态系统,你可以直接跳到下一章:Matplotlib: 作图(暂缺)。
本章剩下的内容对于学习介绍部分不是必须的。但是,记得回来完成本章并且完成更多的练习。
## 1.3.3 数据的更多内容
### 1.3.3.1 更多的数据类型
#### 1.3.3.1.1 投射
“更大”的类型在混合类型操作中胜出:
In [175]:
```
np.array([1, 2, 3]) + 1.5
```
Out[175]:
```
array([ 2.5, 3.5, 4.5])
```
赋值不会改变类型!
In [176]:
```
a = np.array([1, 2, 3])
a.dtype
```
Out[176]:
```
dtype('int64')
```
In [178]:
```
a[0] = 1.9 # <-- 浮点被截取为整数
a
```
Out[178]:
```
array([1, 2, 3])
```
强制投射:
In [179]:
```
a = np.array([1.7, 1.2, 1.6])
b = a.astype(int) # <-- 截取整数
b
```
Out[179]:
```
array([1, 1, 1])
```
四舍五入:
In [180]:
```
a = np.array([1.2, 1.5, 1.6, 2.5, 3.5, 4.5])
b = np.around(a)
b # 仍然是浮点
```
Out[180]:
```
array([ 1., 2., 2., 2., 4., 4.])
```
In [181]:
```
c = np.around(a).astype(int)
c
```
Out[181]:
```
array([1, 2, 2, 2, 4, 4])
```
#### 1.3.3.1.2 不同数据类型的大小
整数 (带有符号):
| 类型 | 字节数 |
| --- | --- |
| int8 | 8 bits |
| int16 | 16 bits |
| int32 | 32 bits (与32位平台的int相同) |
| int64 | 64 bits (与64位平台的int相同) |
In [182]:
```
np.array([1], dtype=int).dtype
```
Out[182]:
```
dtype('int64')
```
In [183]:
```
np.iinfo(np.int32).max, 2**31 - 1
```
Out[183]:
```
(2147483647, 2147483647)
```
In [184]:
```
np.iinfo(np.int64).max, 2**63 - 1
```
Out[184]:
```
(9223372036854775807, 9223372036854775807L)
```
无符号整数:
| 类型 | 字节数 |
| --- | --- |
| uint8 | 8 bits |
| uint16 | 16 bits |
| uint32 | 32 bits |
| uint64 | 64 bits |
In [185]:
```
np.iinfo(np.uint32).max, 2**32 - 1
```
Out[185]:
```
(4294967295, 4294967295)
```
In [186]:
```
np.iinfo(np.uint64).max, 2**64 - 1
```
Out[186]:
```
(18446744073709551615L, 18446744073709551615L)
```
浮点数据:
| 类型 | 字节数 |
| --- | --- |
| float16 | 16 bits |
| float32 | 32 bits |
| float64 | 64 bits (与浮点相同) |
| float96 | 96 bits, 平台依赖 (与 `np.longdouble` 相同) |
| float128 | 128 bits, 平台依赖 (与 `np.longdouble`相同) |
In [187]:
```
np.finfo(np.float32).eps
```
Out[187]:
```
1.1920929e-07
```
In [188]:
```
np.finfo(np.float64).eps
```
Out[188]:
```
2.2204460492503131e-16
```
In [189]:
```
np.float32(1e-8) + np.float32(1) == 1
```
Out[189]:
```
True
```
In [190]:
```
np.float64(1e-8) + np.float64(1) == 1
```
Out[190]:
```
False
```
浮点复数:
| 类型 | 字节数 |
| --- | --- |
| complex64 | 两个 32-bit 浮点 |
| complex128 | 两个 64-bit 浮点 |
| complex192 | 两个 96-bit 浮点, 平台依赖 |
| complex256 | 两个 128-bit 浮点, 平台依赖 |
**更小的数据类型**
如果你不知道需要特殊数据类型,那你可能就不需要。
比较使用 `float32`代替 `float64`:
* 一半的内存和硬盘大小
* 需要一半的宽带(可能在一些操作中更快)
In [191]:
```
a = np.zeros((1e6,), dtype=np.float64)
b = np.zeros((1e6,), dtype=np.float32)
%timeit a*a
```
```
1000 loops, best of 3: 1.41 ms per loop
```
In [192]:
```
%timeit b*b
```
```
1000 loops, best of 3: 739 µs per loop
```
* 但是更大的四舍五入误差 - 有时在一些令人惊喜的地方(即,不要使用它们除非你真的需要)
### 1.3.3.2 结构化的数据类型
| 名称 | 类型 |
| --- | --- |
| sensor_code | (4个字母的字符) |
| position | (浮点) |
| value | (浮点) |
In [194]:
```
samples = np.zeros((6,), dtype=[('sensor_code', 'S4'),('position', float), ('value', float)])
samples.ndim
```
Out[194]:
```
1
```
In [195]:
```
samples.shape
```
Out[195]:
```
(6,)
```
In [196]:
```
samples.dtype.names
```
Out[196]:
```
('sensor_code', 'position', 'value')
```
In [198]:
```
samples[:] = [('ALFA', 1, 0.37), ('BETA', 1, 0.11), ('TAU', 1, 0.13),('ALFA', 1.5, 0.37), ('ALFA', 3, 0.11),
('TAU', 1.2, 0.13)]
samples
```
Out[198]:
```
array([('ALFA', 1.0, 0.37), ('BETA', 1.0, 0.11), ('TAU', 1.0, 0.13),
('ALFA', 1.5, 0.37), ('ALFA', 3.0, 0.11), ('TAU', 1.2, 0.13)],
dtype=[('sensor_code', 'S4'), ('position', '<f8'), ('value', '<f8')])
```
用字段名称索引也可以访问字段:
In [199]:
```
samples['sensor_code']
```
Out[199]:
```
array(['ALFA', 'BETA', 'TAU', 'ALFA', 'ALFA', 'TAU'],
dtype='|S4')
```
In [200]:
```
samples['value']
```
Out[200]:
```
array([ 0.37, 0.11, 0.13, 0.37, 0.11, 0.13])
```
In [201]:
```
samples[0]
```
Out[201]:
```
('ALFA', 1.0, 0.37)
```
In [202]:
```
samples[0]['sensor_code'] = 'TAU'
samples[0]
```
Out[202]:
```
('TAU', 1.0, 0.37)
```
一次多个字段:
In [203]:
```
samples[['position', 'value']]
```
Out[203]:
```
array([(1.0, 0.37), (1.0, 0.11), (1.0, 0.13), (1.5, 0.37), (3.0, 0.11),
(1.2, 0.13)],
dtype=[('position', '<f8'), ('value', '<f8')])
```
和普通情况一样,象征索引也有效:
In [204]:
```
samples[samples['sensor_code'] == 'ALFA']
```
Out[204]:
```
array([('ALFA', 1.5, 0.37), ('ALFA', 3.0, 0.11)],
dtype=[('sensor_code', 'S4'), ('position', '<f8'), ('value', '<f8')])
```
**注**:构建结构化数组有需要其他的语言,见[这里](http://docs.scipy.org/doc/numpy/user/basics.rec.html)和[这里](http://docs.scipy.org/doc/numpy/reference/arrays.dtypes.html#specifying-and-constructing-data-types)。
### 1.3.3.3 面具数组(maskedarray): 处理缺失值(的传播)
* 对于浮点不能用NaN,但是面具对所有类型都适用:
In [207]:
```
x = np.ma.array([1, 2, 3, 4], mask=[0, 1, 0, 1])
x
```
Out[207]:
```
masked_array(data = [1 -- 3 --],
mask = [False True False True],
fill_value = 999999)
```
In [208]:
```
y = np.ma.array([1, 2, 3, 4], mask=[0, 1, 1, 1])
x + y
```
Out[208]:
```
masked_array(data = [2 -- -- --],
mask = [False True True True],
fill_value = 999999)
```
* 通用函数的面具版本:
In [209]:
```
np.ma.sqrt([1, -1, 2, -2])
```
Out[209]:
```
masked_array(data = [1.0 -- 1.4142135623730951 --],
mask = [False True False True],
fill_value = 1e+20)
```
**注**:有许多其他数组的[兄弟姐妹](http://scipy-lectures.github.io/advanced/advanced_numpy/index.html#array-siblings)
尽管这脱离了Numpy这章的主题,让我们花点时间回忆一下编写代码的最佳实践,从长远角度这绝对是值得的:
**最佳实践**
* 明确的变量名(不需要备注去解释变量里是什么)
* 风格:逗号后及=周围有空格等。
在[Python代码风格指南](http://www.python.org/dev/peps/pep-0008)及[文档字符串惯例](http://www.python.org/dev/peps/pep-0257)页面中给出了相当数据量如何书写“漂亮代码”的规则(并且,最重要的是,与其他人使用相同的惯例!)。
* 除非在一些及特殊的情况下,变量名及备注用英文。
## 1.3.4 高级操作
1.3.4.1\. 多项式
Numpy也包含不同基的多项式:
例如,$3x^2 + 2x - 1$:
In [211]:
```
p = np.poly1d([3, 2, -1])
p(0)
```
Out[211]:
```
-1
```
In [212]:
```
p.roots
```
Out[212]:
```
array([-1\. , 0.33333333])
```
In [213]:
```
p.order
```
Out[213]:
```
2
```
In [215]:
```
x = np.linspace(0, 1, 20)
y = np.cos(x) + 0.3*np.random.rand(20)
p = np.poly1d(np.polyfit(x, y, 3))
t = np.linspace(0, 1, 200)
plt.plot(x, y, 'o', t, p(t), '-')
```
Out[215]:
```
[<matplotlib.lines.Line2D at 0x10f40c2d0>,
<matplotlib.lines.Line2D at 0x10f40c510>]
```
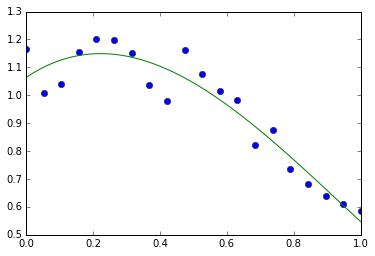
更多内容见[http://docs.scipy.org/doc/numpy/reference/routines.polynomials.poly1d.html。](http://docs.scipy.org/doc/numpy/reference/routines.polynomials.poly1d.html。)
#### 1.3.4.1.1 更多多项式(有更多的基)
Numpy也有更复杂的多项式接口,支持比如切比雪夫基。
\(3x^2 + 2x - 1\):
In [216]:
```
p = np.polynomial.Polynomial([-1, 2, 3]) # 系数的顺序不同!
p(0)
```
Out[216]:
```
-1.0
```
In [217]:
```
p.roots()
```
Out[217]:
```
array([-1\. , 0.33333333])
```
In [218]:
```
p.degree() # 在普通的多项式中通常不暴露'order'
```
Out[218]:
```
2
```
在切尔雪夫基中使用多项式的例子,多项式的范围在[-1,1]:
In [221]:
```
x = np.linspace(-1, 1, 2000)
y = np.cos(x) + 0.3*np.random.rand(2000)
p = np.polynomial.Chebyshev.fit(x, y, 90)
t = np.linspace(-1, 1, 200)
plt.plot(x, y, 'r.')
plt.plot(t, p(t), 'k-', lw=3)
```
Out[221]:
```
[<matplotlib.lines.Line2D at 0x10f442d10>]
```
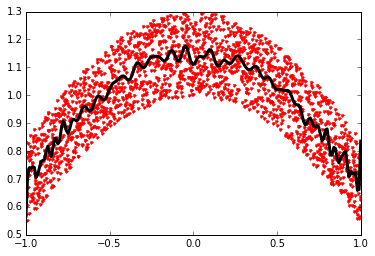
切尔雪夫多项式在插入方面有很多优势。
### 1.3.4.2 加载数据文件
#### 1.3.4.2.1 文本文件
例子: [populations.txt](http://scipy-lectures.github.io/_downloads/populations.txt):
```
# year hare lynx carrot
1900 30e3 4e3 48300
1901 47.2e3 6.1e3 48200
1902 70.2e3 9.8e3 41500
1903 77.4e3 35.2e3 38200
```
In [222]:
```
data = np.loadtxt('data/populations.txt')
data
```
Out[222]:
```
array([[ 1900., 30000., 4000., 48300.],
[ 1901., 47200., 6100., 48200.],
[ 1902., 70200., 9800., 41500.],
[ 1903., 77400., 35200., 38200.],
[ 1904., 36300., 59400., 40600.],
[ 1905., 20600., 41700., 39800.],
[ 1906., 18100., 19000., 38600.],
[ 1907., 21400., 13000., 42300.],
[ 1908., 22000., 8300., 44500.],
[ 1909., 25400., 9100., 42100.],
[ 1910., 27100., 7400., 46000.],
[ 1911., 40300., 8000., 46800.],
[ 1912., 57000., 12300., 43800.],
[ 1913., 76600., 19500., 40900.],
[ 1914., 52300., 45700., 39400.],
[ 1915., 19500., 51100., 39000.],
[ 1916., 11200., 29700., 36700.],
[ 1917., 7600., 15800., 41800.],
[ 1918., 14600., 9700., 43300.],
[ 1919., 16200., 10100., 41300.],
[ 1920., 24700., 8600., 47300.]])
```
In [224]:
```
np.savetxt('pop2.txt', data)
data2 = np.loadtxt('pop2.txt')
```
**注**:如果你有一个复杂的文本文件,应该尝试:
* `np.genfromtxt`
* 使用Python的I/O函数和例如正则式来解析(Python特别适合这个工作)
**提示:用IPython在文件系统中航行**
In [225]:
```
pwd # 显示当前目录
```
Out[225]:
```
u'/Users/cloga/Documents/scipy-lecture-notes_cn'
```
In [227]:
```
cd data
```
```
/Users/cloga/Documents/scipy-lecture-notes_cn/data
```
In [228]:
```
ls
```
```
populations.txt
```
#### 1.3.4.2.2 图像
使用Matplotlib:
In [233]:
```
img = plt.imread('data/elephant.png')
img.shape, img.dtype
```
Out[233]:
```
((200, 300, 3), dtype('float32'))
```
In [234]:
```
plt.imshow(img)
```
Out[234]:
```
<matplotlib.image.AxesImage at 0x10fd13f10>
```

In [237]:
```
plt.savefig('plot.png')
plt.imsave('red_elephant', img[:,:,0], cmap=plt.cm.gray)
```
```
<matplotlib.figure.Figure at 0x10fba1750>
```
这只保存了一个渠道(RGB):
In [238]:
```
plt.imshow(plt.imread('red_elephant.png'))
```
Out[238]:
```
<matplotlib.image.AxesImage at 0x11040e150>
```

其他包:
In [239]:
```
from scipy.misc import imsave
imsave('tiny_elephant.png', img[::6,::6])
plt.imshow(plt.imread('tiny_elephant.png'), interpolation='nearest')
```
Out[239]:
```
<matplotlib.image.AxesImage at 0x110bfbfd0>
```
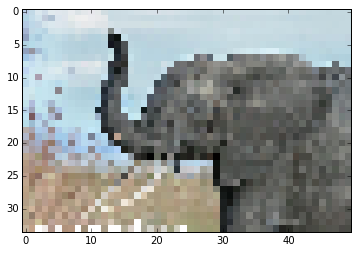
#### 1.3.4.2.3 Numpy的自有格式
Numpy有自有的二进制格式,没有便携性但是I/O高效:
In [240]:
```
data = np.ones((3, 3))
np.save('pop.npy', data)
data3 = np.load('pop.npy')
```
#### 1.3.4.2.4 知名的(并且更复杂的)文件格式
* HDF5: [h5py](http://code.google.com/p/h5py/), [PyTables](http://pytables.org/)
* NetCDF: `scipy.io.netcdf_file`, [netcdf4-python](http://code.google.com/p/netcdf4-python/), ...
* Matlab: `scipy.io.loadmat`, `scipy.io.savemat`
* MatrixMarket: `scipy.io.mmread`, `scipy.io.mmread`
... 如果有人使用,那么就可能有一个对应的Python库。
**练习:文本数据文件**
写一个Python脚本从[populations.txt](http://scipy-lectures.github.io/_downloads/populations.txt)加载数据,删除前五行和后五行。将这个小数据集存入 `pop2.txt`。
**Numpy内部**
如果你对Numpy的内部感兴趣, 有一个关于[Advanced Numpy](http://scipy-lectures.github.io/advanced/advanced_numpy/index.html#advanced-numpy)的很好的讨论。
## 1.3.5 一些练习
### 1.3.5.1 数组操作
* 从2D数组(不需要显示的输入):
```
[[1, 6, 11],
[2, 7, 12],
[3, 8, 13],
[4, 9, 14],
[5, 10, 15]]
```
并且生成一个第二和第四行的新数组。
* 将数组a的每一列以元素的方式除以数组b (提示: `np.newaxis`):
In [243]:
```
a = np.arange(25).reshape(5, 5)
b = np.array([1., 5, 10, 15, 20])
```
* 难一点的题目:创建10 X 3的随机数数组 (在[0, 1]的范围内)。对于每一行,挑出最接近0.5的数。
* 用 `abs`和 `argsort`找到每一行中最接近的列 `j`。
* 使用象征索引抽取数字。(提示:a[i,j]-数组 `i` 必须包含 `j` 中成分的对应行数)
### 1.3.5.2 图片操作:给Lena加边框
让我们从著名的Lena图([http://www.cs.cmu.edu/~chuck/lennapg/)](http://www.cs.cmu.edu/~chuck/lennapg/)) 上开始,用Numpy数组做一些操作。Scipy在 `scipy.lena`函数中提供了这个图的二维数组:
In [244]:
```
from scipy import misc
lena = misc.lena()
```
**注**:在旧版的scipy中,你会在 `scipy.lena()`找到lena。
这是一些通过我们的操作可以获得图片:使用不同的颜色地图,裁剪图片,改变图片的一部分。

* 让我们用pylab的 `imshow`函数显示这个图片。
In [245]:
```
import pylab as plt
lena = misc.lena()
plt.imshow(lena)
```
Out[245]:
```
<matplotlib.image.AxesImage at 0x110f51ad0>
```
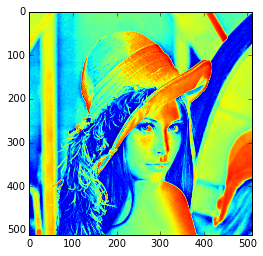
* Lena然后以为色彩显示。要将她展示为灰色需要指定一个颜色地图。
In [246]:
```
plt.imshow(lena, cmap=plt.cm.gray)
```
Out[246]:
```
<matplotlib.image.AxesImage at 0x110fb15d0>
```

* 用一个更小的图片中心来创建数组:例如,从图像边缘删除30像素。要检查结果,用 `imshow` 显示这个新数组。
In [247]:
```
crop_lena = lena[30:-30,30:-30]
```
* 现在我们为Lena的脸加一个黑色项链形边框。要做到这一点,需要创建一个面具对应于需要变成黑色的像素。这个面具由如下条件定义 `(y-256)**2 + (x-256)**2`
In [248]:
```
y, x = np.ogrid[0:512,0:512] # x 和 y 像素索引
y.shape, x.shape
```
Out[248]:
```
((512, 1), (1, 512))
```
In [249]:
```
centerx, centery = (256, 256) # 图像中心
mask = ((y - centery)**2 + (x - centerx)**2) > 230**2 # 圆形
```
接下来我们为面具对应的图片像素赋值为0。语句非常简单并且直觉化:
In [253]:
```
lena[mask] = 0
plt.imshow(lena)
```
Out[253]:
```
<matplotlib.image.AxesImage at 0x113d33fd0>
```
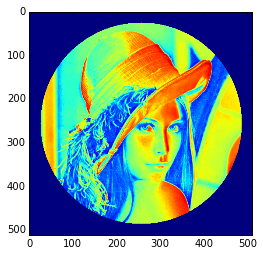
* 接下来:将这个练习的所有命令复制到 `lena_locket.py` 脚本中,并且在IPython中用 `%run lena_locket.py`执行这个脚本,将圆形改为椭圆。
### 1.3.5.3 数据统计
[populations.txt](http://scipy-lectures.github.io/_downloads/populations.txt)中的数据描述了野兔和猞猁(以及胡罗比)在加拿大北部过去十年的数量:
In [254]:
```
data = np.loadtxt('data/populations.txt')
year, hares, lynxes, carrots = data.T # 技巧: 列到变量
plt.axes([0.2, 0.1, 0.5, 0.8])
plt.plot(year, hares, year, lynxes, year, carrots)
plt.legend(('Hare', 'Lynx', 'Carrot'), loc=(1.05, 0.5))
```
Out[254]:
```
<matplotlib.legend.Legend at 0x1135d9510>
```

根据[populations.txt](http://scipy-lectures.github.io/_downloads/populations.txt)中的数据计算并打印...
1. 每个物种在这个时间段内的数量平均数及标准差。
2. 每个物种在哪一年数量最多。
3. 每一年哪个物种数量最多。(提示:`np.array(['H', 'L', 'C'])`的`argsort` 和象征索引)
4. 哪一年数量超过50000。(提示:比较和 `np.any`)
5. 每个物种有最少数量的两年。(提示: `argsort`、象征索引)
6. 比较(作图)野兔和猞猁总量的变化(看一下 `help(np.gradient)`)。看一下相关(见 `help(np.corrcoef)`)。
... 所有都不应该使用for循环。
答案:[Python源文件](http://scipy-lectures.github.io/_downloads/2_2_data_statistics.py)
### 1.3.5.4 粗略积分估计
写一个函数 `f(a, b, c)` 返回$a^b - c$。组成一个24x12x6数组其中包含它值在参数范围[0,1] x [0,1] x [0,1]。
接近的3-D积分

在这个体积之上有相同的平均数。准确的结果是... - 你的相对误差是多少?
(技巧:使用元素级别的操作和广播。你可以用 `np.ogrid` 获得在 `np.ogrid[0:1:20j]` 范围内的数据点。)
**提醒**Python函数:
In [255]:
```
def f(a, b, c):
return some_result
```
答案:[Python源文件](http://scipy-lectures.github.io/_downloads/2_3_crude_integration.py)
### 1.3.5.5 Mandelbrot集合

写一个脚本计算Mandelbrot分形。Mandelbrot迭代
```
N_max = 50
some_threshold = 50
c = x + 1j*y
for j in xrange(N_max):
z = z**2 + c
```
点(x, y)属于Mandelbrot集合,如果|c| < some_threshold。
作如下计算:
* 构建一个网格 c = x + 1j*y, 值在范围[-2, 1] x [-1.5, 1.5]
* 进行迭代
* 构建2-D布尔面具标识输入集合中的点
* 用下列方法将结果保存到图片:
```
import matplotlib.pyplot as plt
plt.imshow(mask.T, extent=[-2, 1, -1.5, 1.5])
plt.gray()
plt.savefig('mandelbrot.png')
```
答案:[Python源文件](http://scipy-lectures.github.io/_downloads/2_4_mandelbrot.py)
### 1.3.5.6 马尔科夫链

马尔可夫链过渡矩阵P以及在状态p的概率分布:
1. `0 <= P[i,j] <= 1`:从状态i变化到j的概率
2. 过度规则: $p_{new} = P^T p_{old}$
3. `all(sum(P, axis=1) == 1)`, `p.sum() == 1`: 正态化
写一个脚本产生五种状态,并且:
* 构建一个随机矩阵,正态化每一行,以便它是过度矩阵。
* 从一个随机(正态化)概率分布`p`开始,并且进行50步=> `p_50`
* 计算稳定分布:P.T的特征值为1的特征向量(在数字上最接近1)=> `p_stationary`
记住正态化向量 - 我并没有...
* 检查一下 `p_50` 和 `p_stationary`是否等于公差1e-5
工具箱:`np.random.rand`、 `.dot()`、`np.linalg.eig`、reductions、`abs()`、`argmin`、comparisons、`all`、`np.linalg.norm`等。
答案:[Python源文件](http://scipy-lectures.github.io/_downloads/2_5_markov_chain.py)
1.2 Python语言
最后更新于:2022-04-01 11:21:26
# 1.2 Python语言
> 作者 Chris Burns, Christophe Combelles, Emmanuelle Gouillart, Gaël Varoquaux
> **Python中的科学计算** 这里我们介绍Python语言。这里只会仅仅解决可以用于Numpy和Scipy的最低要求。想要更多的了解这门语言,请参考[http://docs.python.org/tutorial](http://docs.python.org/tutorial) 这个非常好的教程。也可以借助专门的图书,比如:[http://diveintopython.org/](http://diveintopython.org/).
Python是一门**编程语言**,与C、Fortran、BASIC和PHP等等类似。Python的一些特性如下:
* 一种_解释性_(不是编译)语言。与C或者Fortran等不同,Python代码在执行前不会编译。另外,Python可以**交互**使用:有许多的Python解释器,命令和脚本可以在其中执行。
* 在**开源**证书下发布的免费软件:Python可以免费使用和分发,即使用于商用。
* **多平台**:Python可以用于所有的主流操作系统,Windows、Linux/Unix、MacOS X, 甚至可能是你有手机操作系统等等。
* 可读性很强的语言,有清晰不罗嗦的语法
* 拥有大量高质量的包,可以应用于多种多样的应用,从网站框架到科学计算。
* 非常简单的接口与其他语言交互,特别是C和C++
* 稍后会介绍一些语言的其他特性。例如Python是面向对象的语言,包含动态类型(一个变量可以在程序过程中,可以包含不同的对象类型)。
Python的特有特性的更多信息,请见:[http://www.python.org/about/](http://www.python.org/about/)
## 1.2.1 第一步
启动**IPython** Shell(一个增强的Python交互Shell):
* 在Linux/Mac终端中输入“ipython”,或者在Windows cmd sheell,
* 或者从菜单启动程序,即在[Python(x,y)](http://www.pythonxy.com/)或[EPD](http://www.enthought.com/products/epd.php),如果你已经安装这些Python科学套装之一。
如果你的电脑上还没有安装IPython,也可以选择其他Python shells,比如在终端中输入“Python”启动纯Python shell,或者Idle解释器。但是,我们建议使用IPython Shell,因为它增强特性,特别是对于科学计算。
如果你已经启动了解释器,输入
In [2]:
```
print "Hello, world!"
```
```
Hello, world!
```
接下来就会显示信息"Hello, world!"。你已经执行了你的第一条Python命令,恭喜!
你自己开始吧,输入下列命令
In [1]:
```
a = 3
b = 2*a
type(b)
```
Out[1]:
```
int
```
In [2]:
```
print b
```
```
6
```
In [3]:
```
a*b
```
Out[3]:
```
18
```
In [4]:
```
b = 'hello'
type(b)
```
Out[4]:
```
str
```
In [5]:
```
b + b
```
Out[5]:
```
'hellohello'
```
In [6]:
```
2*b
```
Out[6]:
```
'hellohello'
```
上面定义了_a_和_b_两个变量。注意这里在赋值前没有声明变量类型。相反,在C中,应该写为:
```
int a=3;
```
另外,变量的类型可以改变,在一个时间点它可以等于一个特定类型,在接下来的时间里,他可以等于另外的类型。_b_首先等于整数,但是当它被赋值为_"hello"_时他变成等于字符。在Python中,整数的运算符(b=2*a)原生支持的,一些字符上的操作符例如相加和相乘也是支持的,相当于串联和重复。
## 1.2.2 基础类型
### 1.2.2.1 数值类型
Python支持如下的数值、标量类型:
**整型:**
In [8]:
```
1 + 1
```
Out[8]:
```
2
```
In [11]:
```
a = 4
type(a)
```
Out[11]:
```
int
```
**浮点型:**
In [12]:
```
c = 2.1
type(c)
```
Out[12]:
```
float
```
**复数:**
In [13]:
```
a = 1.5 + 0.5j
a.real
```
Out[13]:
```
1.5
```
In [14]:
```
a.imag
```
Out[14]:
```
0.5
```
In [15]:
```
type(1. + 0j )
```
Out[15]:
```
complex
```
**布尔:**
In [16]:
```
3 > 4
```
Out[16]:
```
False
```
In [17]:
```
test = (3 > 4)
test
```
Out[17]:
```
False
```
In [18]:
```
type(test)
```
Out[18]:
```
bool
```
因此,Python shell可以代替你的口袋计算器,因为基本的代数操作符 +、-、*、/、%(模)都已经原生实现了。
In [19]:
```
7 * 3.
```
Out[19]:
```
21.0
```
In [20]:
```
2**10
```
Out[20]:
```
1024
```
In [21]:
```
8 % 3
```
Out[21]:
```
2
```
类型转化(投射):
In [22]:
```
float(1)
```
Out[22]:
```
1.0
```
**注意**:整数相除
In [23]:
```
3 / 2
```
Out[23]:
```
1
```
**技巧**:使用浮点:
In [24]:
```
3 / 2.
```
Out[24]:
```
1.5
```
In [25]:
```
a = 3
b = 2
a / b
```
Out[25]:
```
1
```
In [26]:
```
a / float(b)
```
Out[26]:
```
1.5
```
如果你明确想要整除,请使用//:
In [27]:
```
3.0 // 2
```
Out[27]:
```
1.0
```
Python3改变了除运算符行为。细节请看[python3porting](http://python3porting.com/preparing.html#use-instead-of-when-dividing-integers)网站.
### 1.2.2.2 容器
Python提供了许多有效的容器类型,其中存储了对象集合。
#### 1.2.2.2.1 列表
列表是一个有序的对象集合,对象可以有多种类型。例如:
In [28]:
```
L = ['red', 'blue', 'green', 'black', 'white']
type(L)
```
Out[28]:
```
list
```
索引:访问包含在列表中的单个对象:
In [29]:
```
L[2]
```
Out[29]:
```
'green'
```
使用负索引,从结尾开始计数:
In [30]:
```
L[-1]
```
Out[30]:
```
'white'
```
In [31]:
```
L[-2]
```
Out[31]:
```
'black'
```
**注意:索引从0开始**(和C中一样),而不是1(像在Fortran或Matlab)!
切片:获得规律分布元素的子列表:
In [32]:
```
L
```
Out[32]:
```
['red', 'blue', 'green', 'black', 'white']
```
In [33]:
```
L[2:4]
```
Out[33]:
```
['green', 'black']
```
**注意**:L[start:stop]包含索引start<= i < stop的元素(i的范围从start到stop-1)。因此,L[start:stop]包含(stop-start)个元素。
**切片语法**:`L[start:stop:stride]`
所有切片参数都是可选的:
In [34]:
```
L
```
Out[34]:
```
['red', 'blue', 'green', 'black', 'white']
```
In [35]:
```
L[3:]
```
Out[35]:
```
['black', 'white']
```
In [36]:
```
L[:3]
```
Out[36]:
```
['red', 'blue', 'green']
```
列表是可变对象,可以被改变:
In [38]:
```
L[0] = 'yellow'
L
```
Out[38]:
```
['yellow', 'blue', 'green', 'black', 'white']
```
In [39]:
```
L[2:4] = ['gray', 'purple']
L
```
Out[39]:
```
['yellow', 'blue', 'gray', 'purple', 'white']
```
**注:**一个列表的元素可以有不同的类型:
In [40]:
```
L = [3, -200, 'hello']
L
```
Out[40]:
```
[3, -200, 'hello']
```
In [41]:
```
L[1], L[2]
```
Out[41]:
```
(-200, 'hello')
```
对于一个所有类型都相同的数值数据集合,使用Numpy模块提供的数组类型通常更有效。Numpy数组是包含固定大小项目的内存组块。使用Numpy数组,元素上的操作可以非常快速,因为元素均匀分布在内存上并且更多的操作是通过特殊的C函数而不是Python循环。
Python提供了一大组函数来修改或查询列表。这里是一些例子,更多内容,请见:[http://docs.python.org/tutorial/datastructures.html#more-on-lists](http://docs.python.org/tutorial/datastructures.html#more-on-lists)
添加和删除元素:
In [42]:
```
L = ['red', 'blue', 'green', 'black', 'white']
L.append('pink')
L
```
Out[42]:
```
['red', 'blue', 'green', 'black', 'white', 'pink']
```
In [43]:
```
L.pop() # 删除并返回最后一个项目
```
Out[43]:
```
'pink'
```
In [44]:
```
L
```
Out[44]:
```
['red', 'blue', 'green', 'black', 'white']
```
In [45]:
```
L.extend(['pink', 'purple']) # 扩展列表L,原地
L
```
In [46]:
```
L = L[:-2]
L
```
Out[46]:
```
['red', 'blue', 'green', 'black', 'white']
```
反转:
In [47]:
```
r = L[::-1]
r
```
Out[47]:
```
['white', 'black', 'green', 'blue', 'red']
```
In [48]:
```
r2 = list(L)
r2
```
Out[48]:
```
['red', 'blue', 'green', 'black', 'white']
```
In [49]:
```
r2.reverse() # 原对象
r2
```
Out[49]:
```
['white', 'black', 'green', 'blue', 'red']
```
串联和重复列表:
In [50]:
```
r + L
```
Out[50]:
```
['white',
'black',
'green',
'blue',
'red',
'red',
'blue',
'green',
'black',
'white']
```
In [51]:
```
r * 2
```
Out[51]:
```
['white',
'black',
'green',
'blue',
'red',
'white',
'black',
'green',
'blue',
'red']
```
排序:
In [52]:
```
sorted(r) # 新对象
```
Out[52]:
```
['black', 'blue', 'green', 'red', 'white']
```
In [53]:
```
r
```
Out[53]:
```
['white', 'black', 'green', 'blue', 'red']
```
In [55]:
```
r.sort() # 原对象
r
```
Out[55]:
```
['black', 'blue', 'green', 'red', 'white']
```
**方法和面向对象编程**
符号r.method() (即 r.append(3) and L.pop()) 是我们第一个关于面向对象编程的例子(OOP)。作为列表,对象r有可以以这种方式调用的方法函数。对于这篇教程不需要关于面向对象编程的更多知识,只需要理解这种符号。
**发现方法**:
提醒:在IPython中:tab完成 (按tab)
```
In [28]: r.<TAB>
r.__add__ r.__iadd__ r.__setattr__
r.__class__ r.__imul__ r.__setitem__
r.__contains__ r.__init__ r.__setslice__
r.__delattr__ r.__iter__ r.__sizeof__
r.__delitem__ r.__le__ r.__str__
r.__delslice__ r.__len__ r.__subclasshook__
r.__doc__ r.__lt__ r.append
r.__eq__ r.__mul__ r.count
r.__format__ r.__ne__ r.extend
r.__ge__ r.__new__ r.index
r.__getattribute__ r.__reduce__ r.insert
r.__getitem__ r.__reduce_ex__ r.pop
r.__getslice__ r.__repr__ r.remove
r.__gt__ r.__reversed__ r.reverse
r.__hash__ r.__rmul__ r.sort
```
#### 1.2.2.2.2 字符
不同的字符语法(单引号、双引号或三个引号):
In [58]:
```
s = 'Hello, how are you?'
s = "Hi, what's up"
s = '''Hello,
how are you''' # 三个引号可以允许字符跨行
s = """Hi,
what's up?"""
'Hi, what's up?'
```
```
File "<ipython-input-58-dfe00f996c26>", line 7
'Hi, what's up?'
^
SyntaxError: invalid syntax
```
如果在字符中要是使用引号,那么应该嵌套使用,或者使用"\"进行转义,否则会报错。
换行的符号为 \n,tab符号是\t。
字符也是类似与列表的结合。因此,也可以使用相同的语法和规则索引和切片。
索引:
In [59]:
```
a = "hello"
a[0]
```
Out[59]:
```
'h'
```
In [60]:
```
a[1]
```
Out[60]:
```
'e'
```
In [61]:
```
a[-1]
```
Out[61]:
```
'o'
```
(记住负索引从右侧开始计数。)
切片:
In [64]:
```
a = "hello, world!"
a[3:6] # 第三到第六个(不包含)元素:元素3、4、5
```
Out[64]:
```
'lo,'
```
In [65]:
```
a[2:10:2] # 语法:a[开始:结束:步幅]
```
Out[65]:
```
'lo o'
```
In [66]:
```
a[::3] # 从开始到结尾,每隔3个字母
```
Out[66]:
```
'hl r!'
```
重音符号和特殊字符也可以被处理为Unicode字符(请见 [http://docs.python.org/tutorial/introduction.html#unicode-strings)。](http://docs.python.org/tutorial/introduction.html#unicode-strings)。)
字符是**不可变**对象,不可能修改内容。不过可以从原始的字符中创建一个新的字符。
In [68]:
```
a = "hello, world!"
a[2] = 'z'
```
```
---------------------------------------------------------------------------
TypeError Traceback (most recent call last)
<ipython-input-68-8f124c87c8cf> in <module>()
1 a = "hello, world!"
----> 2 a[2] = 'z'
TypeError: 'str' object does not support item assignment
```
In [69]:
```
a.replace('l', 'z', 1)
```
Out[69]:
```
'hezlo, world!'
```
In [70]:
```
a.replace('l', 'z')
```
Out[70]:
```
'hezzo, worzd!'
```
字符有许多有用的方法,比如上面的a.replace。回忆一下a.面向对象的符号,并且使用tab完成或者help(str)来搜索新的方法。and use tab completion or
**更多内容** Python提供了操作的字符的高级可能性,看一下模式或格式。感兴趣的读者请参考:[http://docs.python.org/library/stdtypes.html#string-methods](http://docs.python.org/library/stdtypes.html#string-methods) 和 [http://docs.python.org/library/string.html#new-string-formatting。](http://docs.python.org/library/string.html#new-string-formatting。)
字符格式:
In [71]:
```
'An integer: %i; a float: %f; another string: %s' % (1, 0.1, 'string')
```
Out[71]:
```
'An integer: 1; a float: 0.100000; another string: string'
```
In [72]:
```
i = 102
filename = 'processing_of_dataset_%d.txt' % i
filename
```
Out[72]:
```
'processing_of_dataset_102.txt'
```
#### 1.2.2.2.3\. Dictionaries
字典本质上是一个**映射键值**的高效表格。它是一个**无序**的容器
In [74]:
```
tel = {'emmanuelle': 5752, 'sebastian': 5578}
tel['francis'] = 5915
tel
```
Out[74]:
```
{'emmanuelle': 5752, 'francis': 5915, 'sebastian': 5578}
```
In [75]:
```
tel['sebastian']
```
Out[75]:
```
5578
```
In [76]:
```
tel.keys()
```
Out[76]:
```
['sebastian', 'francis', 'emmanuelle']
```
In [77]:
```
tel.values()
```
Out[77]:
```
[5578, 5915, 5752]
```
它可以方便的以名字(日期的字符和名称等)存储和获取值。更多信息见 [http://docs.python.org/tutorial/datastructures.html#dictionaries。](http://docs.python.org/tutorial/datastructures.html#dictionaries。)
一个字典的键(代表值)可以有不同的类型:
In [78]:
```
d = {'a':1, 'b':2, 3:'hello'}
d
```
Out[78]:
```
{3: 'hello', 'a': 1, 'b': 2}
```
#### 1.2.2.2.4\. More container types
**元组**
元组本质上是不可变列表。元组的元素用括号包起来,或者只是用逗号分割:
In [79]:
```
t = 12345, 54321, 'hello!'
t[0]
```
Out[79]:
```
12345
```
In [80]:
```
t
```
Out[80]:
```
(12345, 54321, 'hello!')
```
In [81]:
```
u = (0, 2)
```
**集合**:无序,惟一项目:
In [82]:
```
s = set(('a', 'b', 'c', 'a'))
s
```
Out[82]:
```
{'a', 'b', 'c'}
```
In [83]:
```
s.difference(('a', 'b'))
```
Out[83]:
```
{'c'}
```
#### 1.2.2.3\. 赋值运算
[Python类库参考:](http://docs.python.org/reference/simple_stmts.html#assignment-statements)
> 赋值语句被用于(重)绑定名称与值,以及修改可变对象的项目或属性。
简单来说,它这样工作(简单赋值):
1. 右侧表达式被评估,创建或获得产生的对象
2. 左侧的名字被赋值或绑定到右侧的对象
需要注意的事情:
* 单个对象可以有多个绑定的名称:
In [84]:
```
a = [1, 2, 3]
b = a
a
```
Out[84]:
```
[1, 2, 3]
```
In [85]:
```
b
```
Out[85]:
```
[1, 2, 3]
```
In [86]:
```
a is b
```
Out[86]:
```
True
```
In [87]:
```
b[1] = 'hi!'
a
```
Out[87]:
```
[1, 'hi!', 3]
```
* 要在**原地**改变列表,请使用索引或切片:
In [88]:
```
a = [1, 2, 3]
a
```
Out[88]:
```
[1, 2, 3]
```
In [89]:
```
a = ['a', 'b', 'c'] # 创建另一个对象
a
```
Out[89]:
```
['a', 'b', 'c']
```
In [90]:
```
id(a)
```
Out[90]:
```
4394695640
```
In [91]:
```
a[:] = [1, 2, 3] # 在原地修改对象
a
```
Out[91]:
```
[1, 2, 3]
```
In [92]:
```
id(a)
```
Out[92]:
```
4394695640
```
与上一个id相同,你的可能有所不同...
* 这里的关键观点是可变 vs. 不可变
* 可变对象可以在原地修改
* 不可变对象一旦被创建就不可修改
**更多内容**在David M. Beazley的文章[Python中的类型和对象](http://www.informit.com/articles/article.aspx?p=453682)中也可以找到关于以上问题非常不错的详尽解释。
## 1.2.3 流程控制
控制代码执行顺序。
### 1.2.3.1 if/elif/else
In [93]:
```
if 2**2 == 4:
print 'Obvious!'
```
```
Obvious!
```
**代码块用缩进限定**
**小技巧**:在你的Python解释器内输入下列行,并且注意保持缩进深度。IPython shell会在一行的 : 符号后自动增加缩进,如果要减少缩进,向左侧移动4个空格使用后退键。按两次回车键离开逻辑块。
In [96]:
```
a = 10
if a == 1:
print(1)
elif a == 2:
print(2)
else:
print('A lot')
```
```
A lot
```
在脚本中也是强制缩进的。作为练习,在condition.py脚本中以相同的缩进重新输入之前几行,并在IPython中用`run condition.py`执行脚本。
### 1.2.3.2 for/range
在索引上迭代:
In [97]:
```
for i in range(4):
print(i)
```
```
0
1
2
3
```
但是最经常使用,也更易读的是在值上迭代:
In [98]:
```
for word in ('cool', 'powerful', 'readable'):
print('Python is %s' % word)
```
```
Python is cool
Python is powerful
Python is readable
```
### 1.2.3.3 while/break/continue
典型的C式While循环(Mandelbrot问题):
In [13]:
```
z = 1 + 1j
while abs(z) < 100:
z = z**2 + 1
z
```
Out[13]:
```
(-134+352j)
```
**更高级的功能**
bread 跳出for/while循环:
In [103]:
```
z = 1 + 1j
while abs(z) < 100:
if z.imag == 0:
break
z = z**2 + 1
print z
```
```
(1+2j)
(-2+4j)
(-11-16j)
(-134+352j)
```
continue 继续下一个循环迭代:
In [101]:
```
a = [1, 0, 2, 4]
for element in a:
if element == 0:
continue
print 1. / element
```
```
1.0
0.5
0.25
```
### 1.2.3.4 条件表达式
**if [OBJECT]:**
评估为False:
```
- 任何等于0的数字 (0、0.0、0+0j)
- 空容器(列表、元组、集合、字典, ...)
- False,None
```
评估为True:
```
- 任何其他的东西
```
**a == b:**
判断逻辑是否相等:
In [1]:
```
1 == 1
```
Out[1]:
```
True
```
**a is b:**
测试同一性:两边是相同的对象:
In [2]:
```
1 is 1
```
Out[2]:
```
True
```
In [3]:
```
a = 1
b = 1
a is b
```
Out[3]:
```
True
```
**a in b:**
对于任何集合b:b包含a
In [11]:
```
b = [1, 2, 3]
2 in b
```
Out[11]:
```
True
```
In [12]:
```
5 in b
```
Out[12]:
```
False
```
如果b是字典,这个语法测试a是否是b的一个键。
### 1.2.3.5\. 高级循环
#### 1.2.3.5.1 序列循环
你可以在任何序列上进行循环(字符、列表、字典的键,文件的行...):
In [14]:
```
vowels = 'aeiouy'
for i in 'powerful':
if i in vowels:
print(i),
```
```
o e u
```
In [15]:
```
message = "Hello how are you?"
message.split() # 返回一个列表
```
Out[15]:
```
['Hello', 'how', 'are', 'you?']
```
In [16]:
```
for word in message.split():
print word
```
```
Hello
how
are
you?
```
很少有语言(特别是科学计算语言)允许在整数或索引之外的循环。在Python中,可以在感兴趣的对象上循环,而不用担心你通常不关心的索引。这个功能通常用来让代码更易读。
**警告**:改变正在循环的序列是不安全的。
#### 1.2.3.5.2 跟踪列举数
通常任务是在一个序列上循环,同时跟踪项目数。
```
- 可以像上面,使用带有计数器的while循环。或者一个for循环:
```
In [17]:
```
words = ('cool', 'powerful', 'readable')
for i in range(0, len(words)):
print i, words[i]
```
```
0 cool
1 powerful
2 readable
```
但是,Python为这种情况提供了enumerate关键词:
In [18]:
```
for index, item in enumerate(words):
print index, item
```
```
0 cool
1 powerful
2 readable
```
#### 1.2.3.5.3 字典循环
使用**iteritems**:
In [19]:
```
d = {'a': 1, 'b':1.2, 'c':1j}
for key, val in d.iteritems():
print('Key: %s has value: %s' % (key, val))
```
```
Key: a has value: 1
Key: c has value: 1j
Key: b has value: 1.2
```
#### 1.2.3.5.4 列表理解
In [20]:
```
[i**2 for i in range(4)]
```
Out[20]:
```
[0, 1, 4, 9]
```
**练习**
用Wallis公式,计算π的小数

## 1.2.4\. 定义函数
### 1.2.4.1 函数的定义
In [21]:
```
def test():
print('in test function')
test()
```
```
in test function
```
**注意**:函数块必须像其他流程控制块一样缩进
### 1.2.4.2 返回语句
函数**可以选择**返回值。
In [22]:
```
def disk_area(radius):
return 3.14 * radius * radius
disk_area(1.5)
```
Out[22]:
```
7.0649999999999995
```
**注意**:默认函数返回`None`。
**注意**:注意定义函数的语法:
* def关键字:
* 接下来是函数的名称,然后
* 在冒号后是在括号中的函数的参数。
* 函数体;
* 以及可选返回值的返回对象
### 1.2.4.3 参数
必选参数(位置参数)
In [24]:
```
def double_it(x):
return x * 2
double_it(3)
```
Out[24]:
```
6
```
In [25]:
```
double_it()
```
```
---------------------------------------------------------------------------
TypeError Traceback (most recent call last)
<ipython-input-25-51cdedbb81b0> in <module>()
----> 1 double_it()
TypeError: double_it() takes exactly 1 argument (0 given)
```
可选参数(关键词和命名参数)
In [26]:
```
def double_it(x=2):
return x * 2
double_it()
```
Out[26]:
```
4
```
In [27]:
```
double_it(3)
```
Out[27]:
```
6
```
关键词参数允许你设置特定默认值。
**警告:**默认值在函数定义时被评估,而不是在调用时。如果使用可变类型(即字典或列表)并在函数体内修改他们,这可能会产生问题,因为这个修改会在函数被引用的时候一直持续存在。
在关键词参数中使用不可变类型:
In [2]:
```
bigx = 10
def double_it(x=bigx):
return x * 2
bigx = 1e9 # 现在真的非常大
double_it()
```
Out[2]:
```
20
```
在关键词参数中使用可变类型(并且在函数体内修改它):
In [3]:
```
def add_to_dict(args={'a': 1, 'b': 2}):
for i in args.keys():
args[i] += 1
print args
add_to_dict
```
Out[3]:
```
<function __main__.add_to_dict>
```
In [4]:
```
add_to_dict()
```
```
{'a': 2, 'b': 3}
```
In [5]:
```
add_to_dict()
```
```
{'a': 3, 'b': 4}
```
In [6]:
```
add_to_dict()
```
```
{'a': 4, 'b': 5}
```
更复杂的例子,实现Python的切片:
In [7]:
```
def slicer(seq, start=None, stop=None, step=None):
"""Implement basic python slicing."""
return seq[start:stop:step]
rhyme = 'one fish, two fish, red fish, blue fish'.split()
rhyme
```
Out[7]:
```
['one', 'fish,', 'two', 'fish,', 'red', 'fish,', 'blue', 'fish']
```
In [8]:
```
slicer(rhyme)
```
Out[8]:
```
['one', 'fish,', 'two', 'fish,', 'red', 'fish,', 'blue', 'fish']
```
In [9]:
```
slicer(rhyme, step=2)
```
Out[9]:
```
['one', 'two', 'red', 'blue']
```
In [10]:
```
slicer(rhyme, 1, step=2)
```
Out[10]:
```
['fish,', 'fish,', 'fish,', 'fish']
```
In [11]:
```
slicer(rhyme, start=1, stop=4, step=2)
```
Out[11]:
```
['fish,', 'fish,']
```
关键词参数的顺序**不**重要:
In [12]:
```
slicer(rhyme, step=2, start=1, stop=4)
```
Out[12]:
```
['fish,', 'fish,']
```
但是,最好是使用与函数定义相同的顺序。
_关键词参数_是特别方便的功能,可以用可变数量的参数来定义一个函数,特别是当函数据绝大多数调用都会使用默认值时。
### 1.2.4.4 值传递
可以在一个函数内部改变变量的值吗?大多数语言(C、Java...)区分了“值传递“和”引用传递“。在Python中,没有严格的这种区分,并且视你的变量是否会修改而有一些不同。幸运的是,这些情况存在明确的规则。
函数的参数是对象的引用,传递的是值。当你像一个函数传递了一个变量,Python传递的是对象的引用,这个对象引用的变量(值)。而不是变量本身。
如果**值**传递给函数的值是不可变的,那么这个函数并不会改变调用者的变量。如果**值**是可变的,那么函数将可能在原地修改调用者的变量。
In [13]:
```
def try_to_modify(x, y, z):
x = 23
y.append(42)
z = [99] # 新引用
print(x)
print(y)
print(z)
a = 77 # 不可变变量
b = [99] # 可变变量
c = [28]
try_to_modify(a, b, c)
```
```
23
[99, 42]
[99]
```
In [14]:
```
print(a)
```
```
77
```
In [15]:
```
print(b)
```
```
[99, 42]
```
In [16]:
```
print(c)
```
```
[28]
```
函数有名为_local namespace_的本地变量表。
变量X只存在于函数try_to_modify内部。
### 1.2.4.5 全局变量
在函数外定义的变量可以在函数内引用:
In [18]:
```
x = 5
def addx(y):
return x + y
addx(10)
```
Out[18]:
```
15
```
但是,这些全局变量不能在函数内修改,除非在函数内声明**global**。
这样没用:
In [19]:
```
def setx(y):
x = y
print('x is %d' % x)
setx(10)
```
```
x is 10
```
In [20]:
```
x
```
Out[20]:
```
5
```
这样可以:
In [21]:
```
def setx(y):
global x
x = y
print('x is %d' % x)
setx(10)
```
```
x is 10
```
In [22]:
```
x
```
Out[22]:
```
10
```
### 1.2.4.6 可变数量参数
函数的特殊形式:
```
- *args:封装成元组的任意数量的位置参数
- **kwargs:封装成字典的任意数量的关键词参数
```
In [23]:
```
def variable_args(*args, **kwargs):
print 'args is', args
print 'kwargs is', kwargs
variable_args('one', 'two', x=1, y=2, z=3)
```
```
args is ('one', 'two')
kwargs is {'y': 2, 'x': 1, 'z': 3}
```
### 1.2.4.7 Docstrings
关于函数作用及参数的文档。通常惯例:
In [24]:
```
def funcname(params):
"""Concise one-line sentence describing the function.
Extended summary which can contain multiple paragraphs.
"""
# 函数体
pass
funcname?
```
```
Type: function
Base Class: type 'function'>
String Form: <function funcname at 0xeaa0f0>
Namespace: Interactive
File: <ipython console>
Definition: funcname(params)
Docstring:
Concise one-line sentence describing the function.
Extended summary which can contain multiple paragraphs.
```
**注 Docstring 指导**
为了标准化,Docstring 惯例页面为Python Docstring相关的含义及惯例提供了文档。
Numpy和Scipy模块也为科学计算函数定义了清晰的标准,你可能想要在自己的函数中去遵循,这个标准有参数部分,例子部分等。见[http://projects.scipy.org/numpy/wiki/CodingStyleGuidelines#docstring-standard](http://projects.scipy.org/numpy/wiki/CodingStyleGuidelines#docstring-standard) 及 [http://projects.scipy.org/numpy/browser/trunk/doc/example.py#L37](http://projects.scipy.org/numpy/browser/trunk/doc/example.py#L37)
### 1.2.4.8 函数作为对象
函数是一级对象,这意味着他们可以是:
```
- 可以被赋值给变量
- 列表的一个项目(或任何集合)
- 作为参数传递给另一个函数
```
In [26]:
```
va = variable_args
va('three', x=1, y=2)
```
```
args is ('three',)
kwargs is {'y': 2, 'x': 1}
```
### 1.2.4.9 方法
方法是对象的函数。你已经在我们关于列表、字典和字符等...的例子上看到了。
### 1.2.4.10\. 练习
**练习:斐波那契数列**
写一个函数来展示斐波那契数列的前n个项目,定义如下:
```
- u_0 = 1; u_1 = 1
- u_(n+2) = u_(n+1) + u_n
```
**练习:快速排序**
实现快速排序算法,定义来自wikipedia:
function quicksort(array)
```
var list less, greater if length(array) < 2
return array
select and remove a pivot value pivot from array for each x in array
if x < pivot + 1 then append x to less else append x to greater
return concatenate(quicksort(less), pivot, quicksort(greater))
```
1.1 科学计算工具及流程
最后更新于:2022-04-01 11:21:24
# 1.1 科学计算工具及流程
> 作者 : Fernando Perez, Emmanuelle Gouillart, Gaël Varoquaux, Valentin Haenel
## 1.1.1 为什么是Python?
### 1.1.1.1 科学家的需求
* 获得数据(模拟,实验控制)
* 操作及处理数据
* 可视化结果... 理解我们在做什么!
* 沟通结果:生成报告或出版物的图片,写报告
### 1.1.1.2 要求
* 对于经典的数学方法及基本的方法,有丰富的现成工具:我们不希望重新编写程序去画出曲线、傅立叶变换或者拟合算法。不要重复发明轮子!
* 易于学习:计算机科学不是我们的工作也不是我们的教育背景。我们想要在几分钟内画出曲线,平滑一个信号或者做傅立叶变换,
* 可以方便的与合作者、学生、客户进行交流,代码可以存在于实验室或公司里面:代码的可读性应该像书一样。因此,这种语言应该包含尽可能少的语法符号或者不必要的常规规定,使来自数学或科学领域读者愉悦的理解这些代码。
* 语言高效,执行快...但是不需要是非常快的代码,因为如果我们花费了太多的时间来写代码,非常快的代码也是无用的。
* 一个单一的语言/环境做所有事,如果可能的话,避免每个新问题都要学习新软件
### 1.1.1.3 现有的解决方案
科学家用哪种解决方案进行工作?
### 编译语言:C、C++、Fortran等。
* 优势:
* 非常快。极度优化的编译器。对于大量的计算来说,很难比这些语言的性能更好。
* 一些非常优化的科学计算包。比如:BLAS(向量/矩阵操作)
* 不足:
* 使用起来令人痛苦:开发过程中没有任何互动,强制编译步骤,啰嗦的语法(&, ::, }}, ; 等),手动内存管理(在C中非常棘手)。对于非计算机学家他们是**艰深的语言**。
### 脚本语言:Matlab
* 优势:
* 对不同的领域的多种算法都有非常的类库。执行很快,因为这些类库通常使用编译语言写的。
* 友好的开发环境:完善的、组织良好的帮助,整合的编辑器等
* 有商业支持
* 不足:
* 基础语言非常欠缺,会限制高级用户
* 不是免费的
### 其他脚本语言:Scilab、Octave、Igor、R、IDL等。
* 优势:
* 开源、免费,或者至少比Matlba便宜。
* 一些功能非常高级(R的统计,Igor的图形等。)
* 不足:
* 比Matlab更少的可用算法,语言也并不更高级
* 一些软件更专注于一个领域。比如,Gnuplot或xmgrace画曲线。这些程序非常强大,但是他们只限定于一个单一用途,比如作图。
### 那Python呢?
* 优势:
* 非常丰富的科学计算包(尽管比Matlab少一些)
* 精心设计的语言,允许写出可读性非常好并且结构良好的代码:我们“按照我们所想去写代码”。
* 对于科学计算外的其他任务也有许多类库(网站服务器管理,串口接收等等。)
* 免费的开源软件,广泛传播,有一个充满活力的社区。
* 不足:
* 不太友好的开发环境,比如与Matlab相比。(更加极客向)。
* 并不是在其他专业软件或工具箱中可以找到算法都可以找到
## 1.1.2 Python科学计算的构成
与Matlba,Scilab或者R不同,Python并没有预先绑定的一组科学计算模块。下面是可以组合起来获得科学计算环境的基础的组件。
* **Python**,通用的现代计算语言
* Python语言:数据类型(字符string,整型int),流程控制,数据集合(列表list,字典dict),模式等等。
* 标准库及模块
* 用Pyhon写的大量专业模块及应用:网络协议、网站框架等...以及科学计算。
* 开发工具(自动测试,文档生成)
* **IPython**, 高级的**Python Shell** [http://ipython.org/](http://ipython.org/) 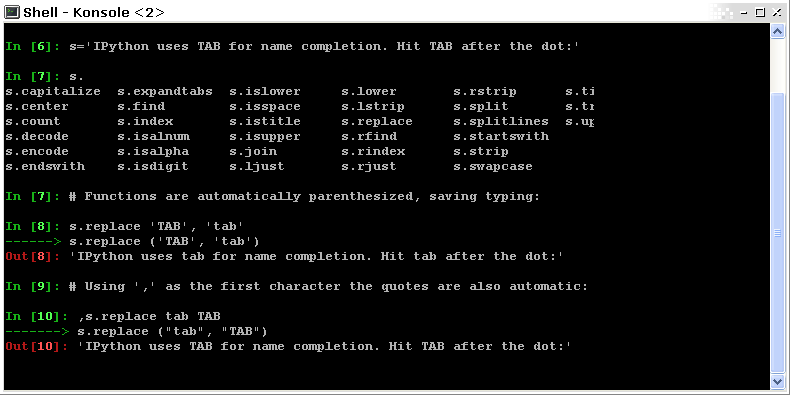
* **Numpy** : 提供了强大数值数组对象以及程序去操作它们。[http://www.numpy.org/](http://www.numpy.org/)
* **Scipy** : 高级的数据处理程序。优化、回归插值等[http://www.scipy.org/](http://www.scipy.org/)
* **Matplotlib** : 2D可视化,“出版级”的图表[http://matplotlib.sourceforge.net/](http://matplotlib.sourceforge.net/) 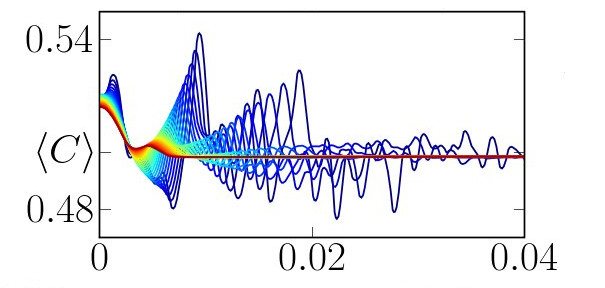
* **Mayavi** : 3D可视化[http://code.enthought.com/projects/mayavi/](http://code.enthought.com/projects/mayavi/) 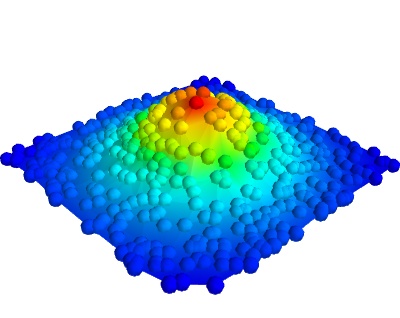
## 1.1.3 交互工作流:IPython和文本编辑器
**测试和理解算法的交互工作**:在这个部分我们描述一下用[IPython](http://ipython.org/)的交互工作流来方便的研究和理解算法。
Python是一门通用语言。与其他的通用语言一样,没有一个绝对权威的工作环境,也不止一种方法使用它。尽管这对新人来说不太好找到适合自己的方式,但是,这使得Python被用于在网站服务器或嵌入设备中编写程序。
> **本部分的参考文档**:
>
> **IPython用户手册**:[http://ipython.org/ipython-doc/dev/index.html](http://ipython.org/ipython-doc/dev/index.html)
### 1.1.3.1 命令行交互
启动ipython:
In [1]:
```
print('Hello world')
```
```
Hello world
```
在对象后使用?运算符获得帮助:
```
In [2]: print
Type: builtin_function_or_method
Base Class: <type ’builtin_function_or_method’>
String Form: <built-in function print>
Namespace: Python builtin
Docstring:
print(value, ..., sep=’ ’, end=’\n’, file=sys.stdout)
Prints the values to a stream, or to sys.stdout by default.
Optional keyword arguments:
file: a file-like object (stream); defaults to the current sys.stdout.
sep: string inserted between values, default a space.
end: string appended after the last value, default a newline.
```
### 1.1.3.2 在编辑器中详尽描述算法
在文本编辑器中,创建一个my_file.py文件。在EPD([Enthought Python Distribution](https://www.enthought.com/products/epd/))中,你可以从开始按钮使用_Scite_。在[Python(x,y)](https://code.google.com/p/pythonxy/)中, 你可以使用Spyder。在Ubuntu中, 如果你还没有最喜欢的编辑器,我们建议你安装[Stani’s Python editor](http://sourceforge.net/projects/spe/)。在这个文件中,输入如下行:
```
s = 'Hello world'
print(s)
```
现在,你可以在IPython中运行它,并研究产生的变量:
In [2]:
```
%run my_file.py
```
```
Hello world
```
In [3]:
```
s
```
Out[3]:
```
'Hello world'
```
In [4]:
```
%whos
```
```
Variable Type Data/Info
----------------------------
s str Hello world
```
> **从脚本到函数**
>
> 尽管仅使用脚本工作很诱人,即一个满是一个接一个命令的文件,但是要有计划的逐渐从脚本进化到一组函数:
>
> * 脚本不可复用,函数可复用。
>
>
> * 以函数的角度思考,有助于将问题拆分为小代码块。
### 1.1.3.3 IPython提示与技巧
IPython用户手册包含关于使用IPython的大量信息,但是,为了帮你你更快的入门,这里快速介绍三个有用的功能:_历史_,_魔法函数_,_别称_和_tab完成_。
与Unix Shell相似,IPython支持命令历史。按上下在之前输入的命令间切换:
```
In [1]: x = 10
In [2]: <UP>
In [2]: x = 10
```
IPython通过在命令前加_%_字符的前缀,支持所谓魔法函数。例如,前面部分的函数_run_和_whos_都是魔法函数。请注意_automagic_设置默认是启用,允许你忽略前面的_%_。因此,你可以只输入魔法函数仍然是有效的。
其他有用的魔法函数:
* **%cd** 改变当前目录
In [6]:
```
cd ..
```
```
/Users/cloga/Documents
```
* **%timeit** 允许你使用来自标准库中的timeit模块来记录执行短代码端的运行时间
In [7]:
```
timeit x = 10
```
```
10000000 loops, best of 3: 26.7 ns per loop
```
* **%cpaste** 允许你粘贴代码,特别是来自网站的代码,前面带有标准的Python提示符 (即 >>>) 或ipython提示符的代码(即 in [3]):
```
In [5]: cpaste
Pasting code; enter ’--’ alone on the line to stop or use Ctrl-D. :In [3]: timeit x = 10
:--
10000000 loops, best of 3: 85.9 ns per loop
In [6]: cpaste
Pasting code; enter ’--’ alone on the line to stop or use Ctrl-D. :>>> timeit x = 10
:--
10000000 loops, best of 3: 86 ns per loop
```
* **%debug** 允许你进入事后除错。也就是说,如果你想要运行的代码抛出了一个异常,使用**%debug**将在抛出异常的位置进入排错程序。
```
In [7]: x === 10
File "<ipython-input-6-12fd421b5f28>", line 1
x === 10 ^
SyntaxError: invalid syntax
In [8]: debug
> /home/esc/anaconda/lib/python2.7/site-packages/IPython/core/compilerop.py(87)ast_parse()
86 and are passed to the built-in compile function."""
---> 87 return compile(source, filename, symbol, self.flags | PyCF_ONLY_AST, 1)
88
ipdb>locals()
{’source’: u’x === 10\n’, ’symbol’: ’exec’, ’self’:
<IPython.core.compilerop.CachingCompiler instance at 0x2ad8ef0>,
’filename’: ’<ipython-input-6-12fd421b5f28>’}
```
> **IPython help**
>
> * 内置的IPython手册可以通过_%quickref_魔法函数进入。
> * 输入_%magic_会显示所有可用魔法函数的列表。
而且IPython提供了大量的_别称_来模拟常见的UNIX命令行工具比如_ls_等于list files,_cp_等于copy files以及_rm_等于remove files。输入_alias_可以显示所有的别称的列表:
In [5]:
```
alias
```
```
Total number of aliases: 12
```
Out[5]:
```
[('cat', 'cat'),
('cp', 'cp'),
('ldir', 'ls -F -G -l %l | grep /$'),
('lf', 'ls -F -l -G %l | grep ^-'),
('lk', 'ls -F -l -G %l | grep ^l'),
('ll', 'ls -F -l -G'),
('ls', 'ls -F -G'),
('lx', 'ls -F -l -G %l | grep ^-..x'),
('mkdir', 'mkdir'),
('mv', 'mv'),
('rm', 'rm'),
('rmdir', 'rmdir')]
```
最后,提一下_tab完成_功能,我们从IPython手册引用它的描述:
> Tab completion, especially for attributes, is a convenient way to explore the structure of any object you’re dealing with. Simply type object_name. <tab>to view the object’s attributes. Besides Python objects and keywords, tab completion also works on file and directory names.</tab>
```
In [1]: x = 10
In [2]: x.<TAB>
x.bit_length x.conjugate x.denominator x.imag x.numerator x.real
In [3]: x.real.
x.real.bit_length x.real.denominator x.real.numerator x.real.conjugate x.real.imag x.real.real
In [4]: x.real.
```