MFC TeeChart用法整理 三(三维图)
最后更新于:2022-04-01 09:38:25
## 画三维图,就要添加三维类型的序列。
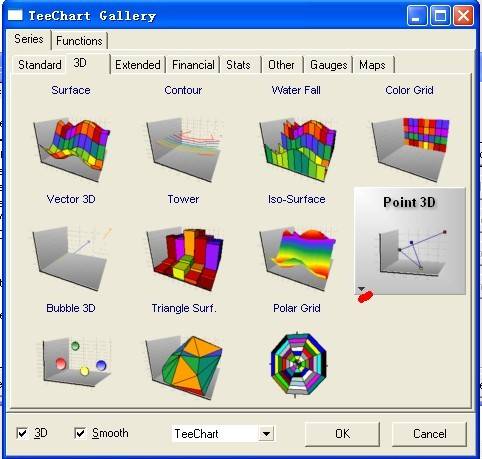
这里我们仍然以折线图作为范例。右击控件选择Properties,在TeeChart Pro Editor选项卡中单击EditChart,在弹出来的对话框中单击Add,在3D选项卡中选中Point 3D类型,单击左下角的倒三角,选择 No Point风格,如下图所示。
下面我们开始添加代码:
~~~
m_TeeChart.GetAspect().SetView3D(TRUE); //显示3D效果
for(int i=0; i<20; i++)
for(int j=0; j<12; j++)
m_TeeChart.Series(0).GetAsPoint3D().AddXYZ(i, j*i, j, NULL, RGB(255,255,0)); //向序列中添加数据,因为这里我们用到Point3D类型的序列,因此用到了GetAsPoint3D这个类数组
~~~
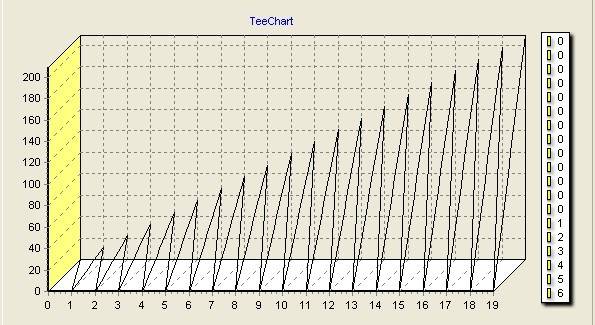
显示Z轴:
~~~
m_TeeChart.GetAspect().SetView3D(TRUE); //显示3D效果
for(int i=0; i<20; i++)
for(int j=0; j<12; j++)
m_TeeChart.Series(0).GetAsPoint3D().AddXYZ(i, j*i, j, NULL, RGB(255,255,0));
m_TeeChart.GetLegend().SetVisible(FALSE); //隐藏图例
m_TeeChart.GetAxis().GetDepth().SetVisible(TRUE); //显示Z轴
m_TeeChart.GetAxis().GetDepth().GetLabels().SetVisible(TRUE); //显示Z轴上的坐标
m_TeeChart.GetAxis().GetDepth().GetLabels().SetStyle(0); //设置显示坐标的风格
~~~
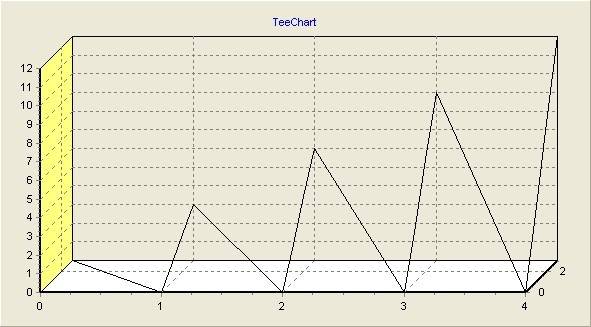
Z轴太窄了,我们可以调宽些:
~~~
m_TeeChart.GetAspect().SetChart3DPercent(50); //参数范围在0~100之间
~~~
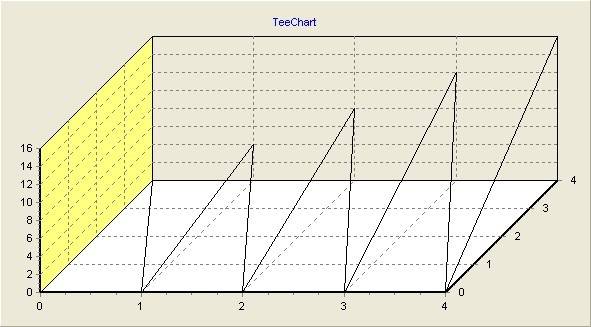
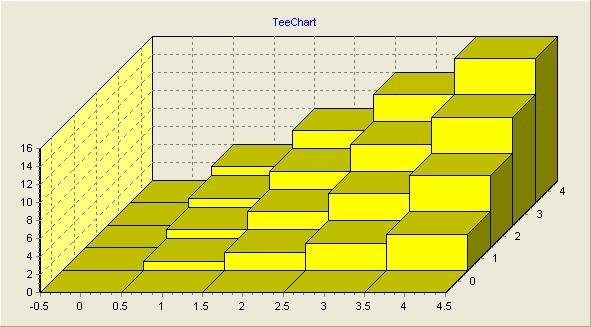
画柱状图与画折线图类似,不过添加序列的时候选择Tower类型序列:
~~~
m_TeeChart.GetAspect().SetView3D(TRUE);
for(int i=0; i<5; i++)
for(int j=0; j<5; j++)
m_TeeChart.Series(0).GetAsTower().AddXYZ(i, j*i, j, NULL, RGB(255,255,0)); //向Tower序列中添加数据
m_TeeChart.GetLegend().SetVisible(FALSE);
m_TeeChart.GetAxis().GetDepth().SetVisible(TRUE);
m_TeeChart.GetAxis().GetDepth().GetLabels().SetVisible(TRUE);
m_TeeChart.GetAxis().GetDepth().GetLabels().SetStyle(0);
m_TeeChart.GetAspect().SetChart3DPercent(50);
~~~
