Scilab 处理声音数据(补充)
最后更新于:2022-04-01 07:31:57
### mapsound
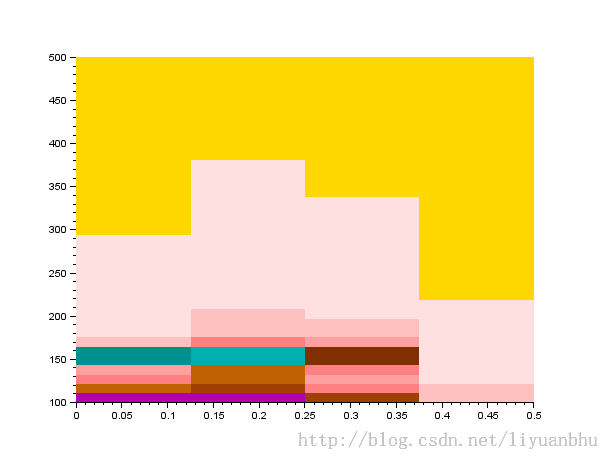
Scilab 中有一个函数可以绘制声音频谱随时间变化的图像。采用的算法是分块进行FFT求得每一时间段内的频谱。唯一一点缺陷是窗函数无法选择,只能是矩形窗。算是个简化版本的短时傅里叶变换。
mapsound (w,dt,fmin,fmax,simpl,rate)
其中 w 是声音数据
Dt 是时窗的宽度,单位是秒
Fmin 和Fmax 限定了绘制的图像的y轴的最小和最大值,单位 Hz。
Simpl 表示在计算时将多少个相邻数据点合成一个数据点计算。
Rate 是信号的采样率
以上各参数的默认值如下:
Dt: 0.1
Fmin: 100
Fmax: 1500
Simpl :1
Rate: 22050
~~~
// At first we create 0.5 seconds of sound parameters.
t=soundsec(0.5);
// Then we generate the sound.
s=sin(440*t)+sin(220*t)/2+sin(880*t)/2;
[nr,nc]=size(t);
s(nc/2:nc)=sin(330*t(nc/2:nc));
mapsound(s,0.1,100,500,1);
~~~

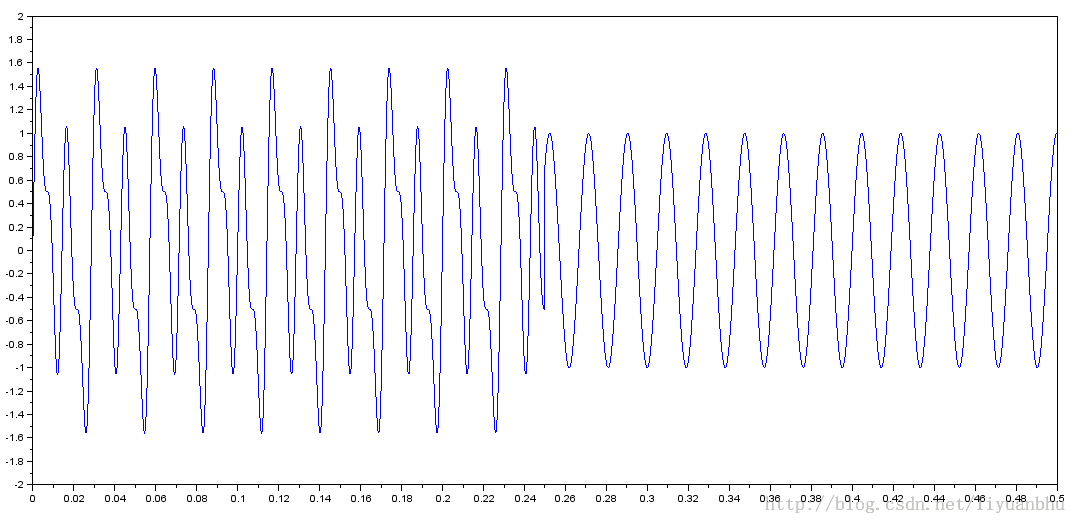
原始声音数据的波形如下:

上面例子中用到了另一个函数soundsec,这个函数的作用很简单,生成一个 n 秒声音数据所需的时间向量。
t=soundsec(n [,rate])
N 是要生成的声音数据的时长
Rate 采样率